
Interactive
Google - digital wellbeing website + interactive tool, 2019


Type: Digital Wellbeing website and interactive self-evaluation tool
Client: Google + external agency, Instrument
Date: May 2019
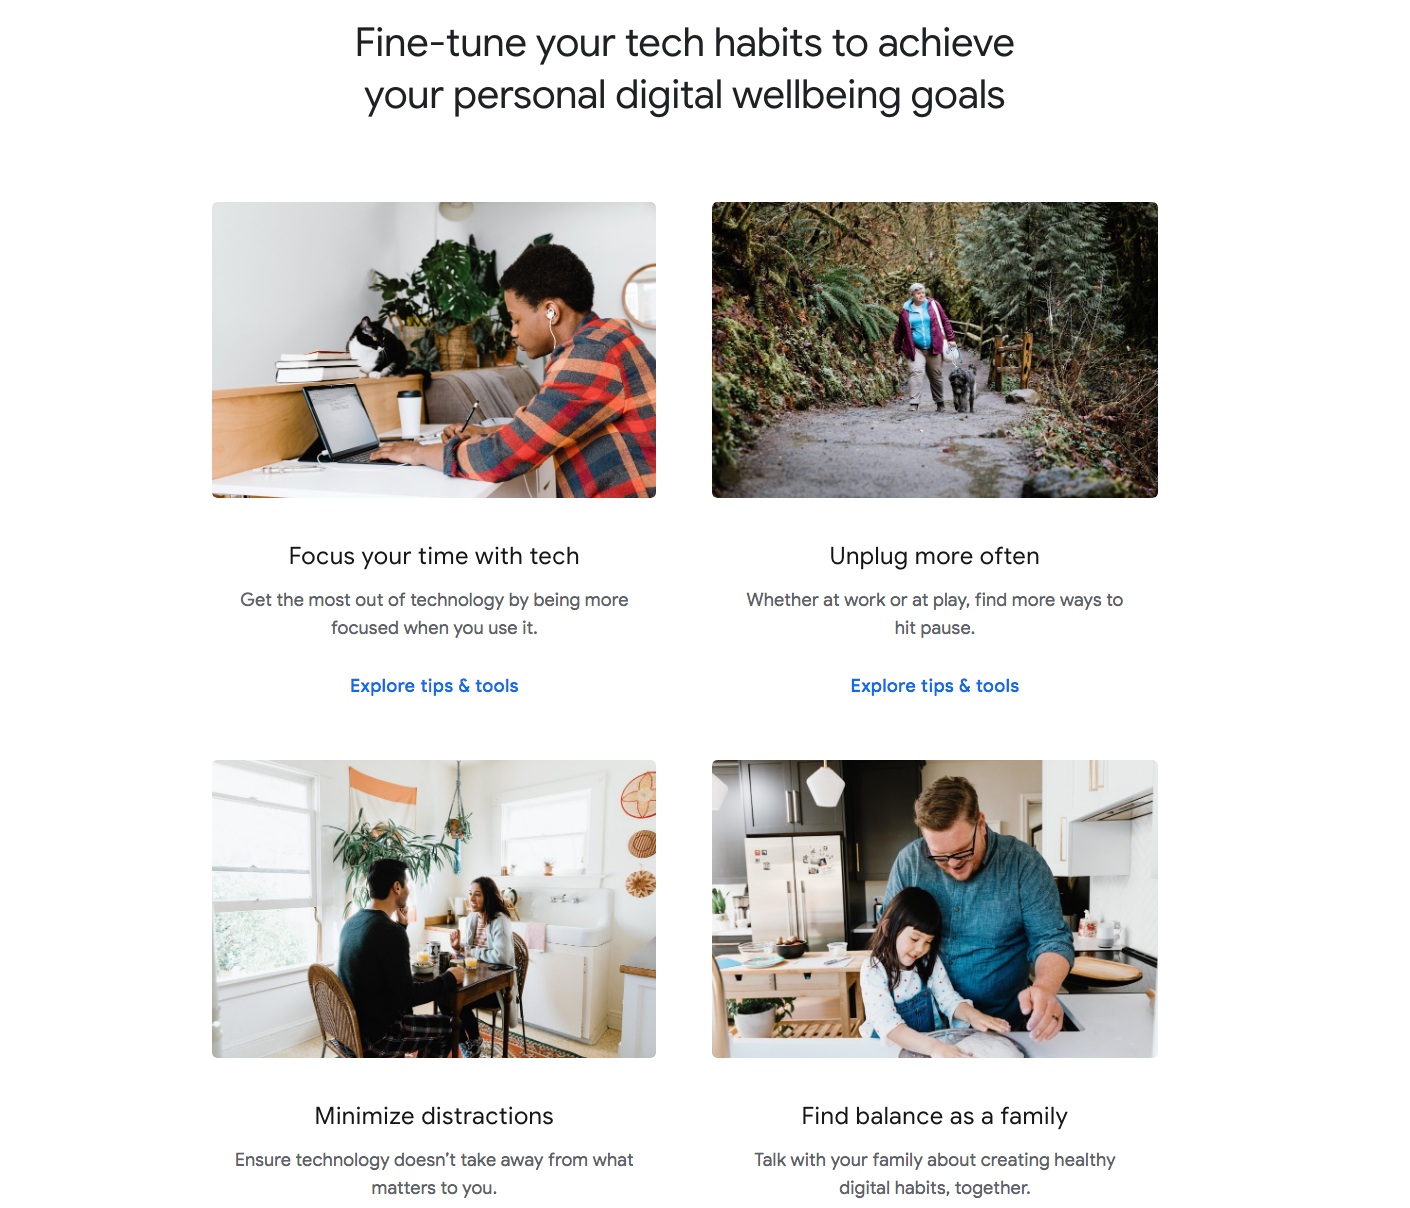
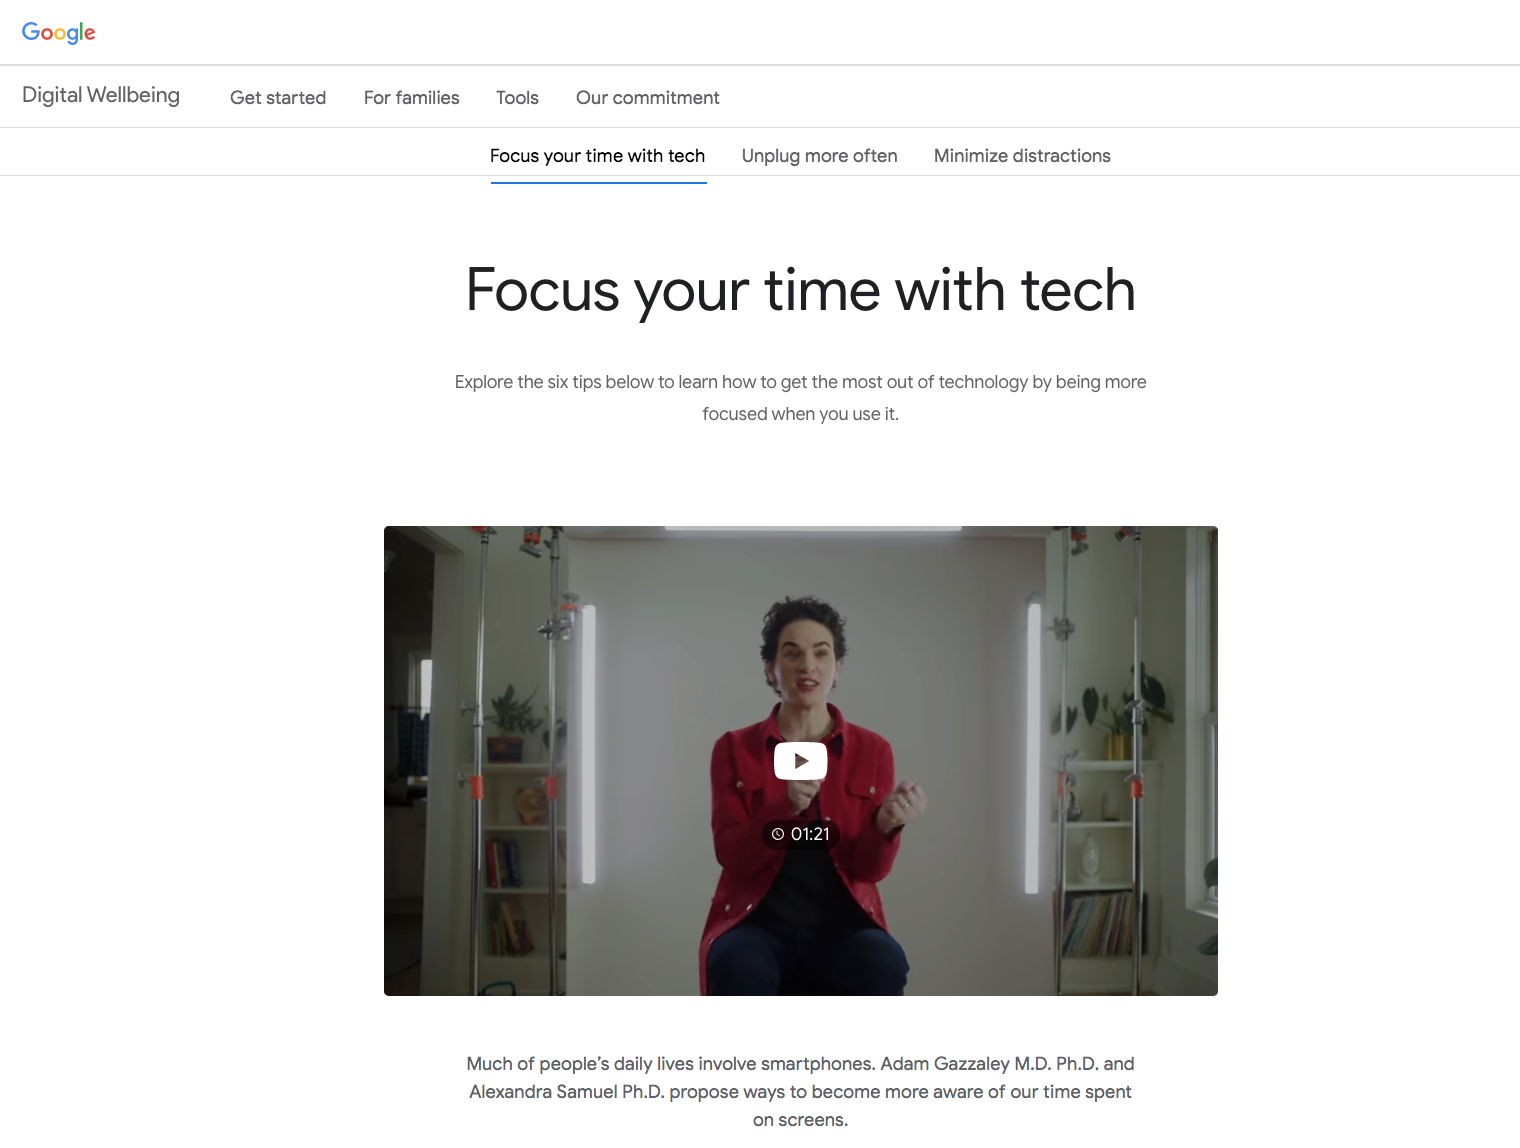
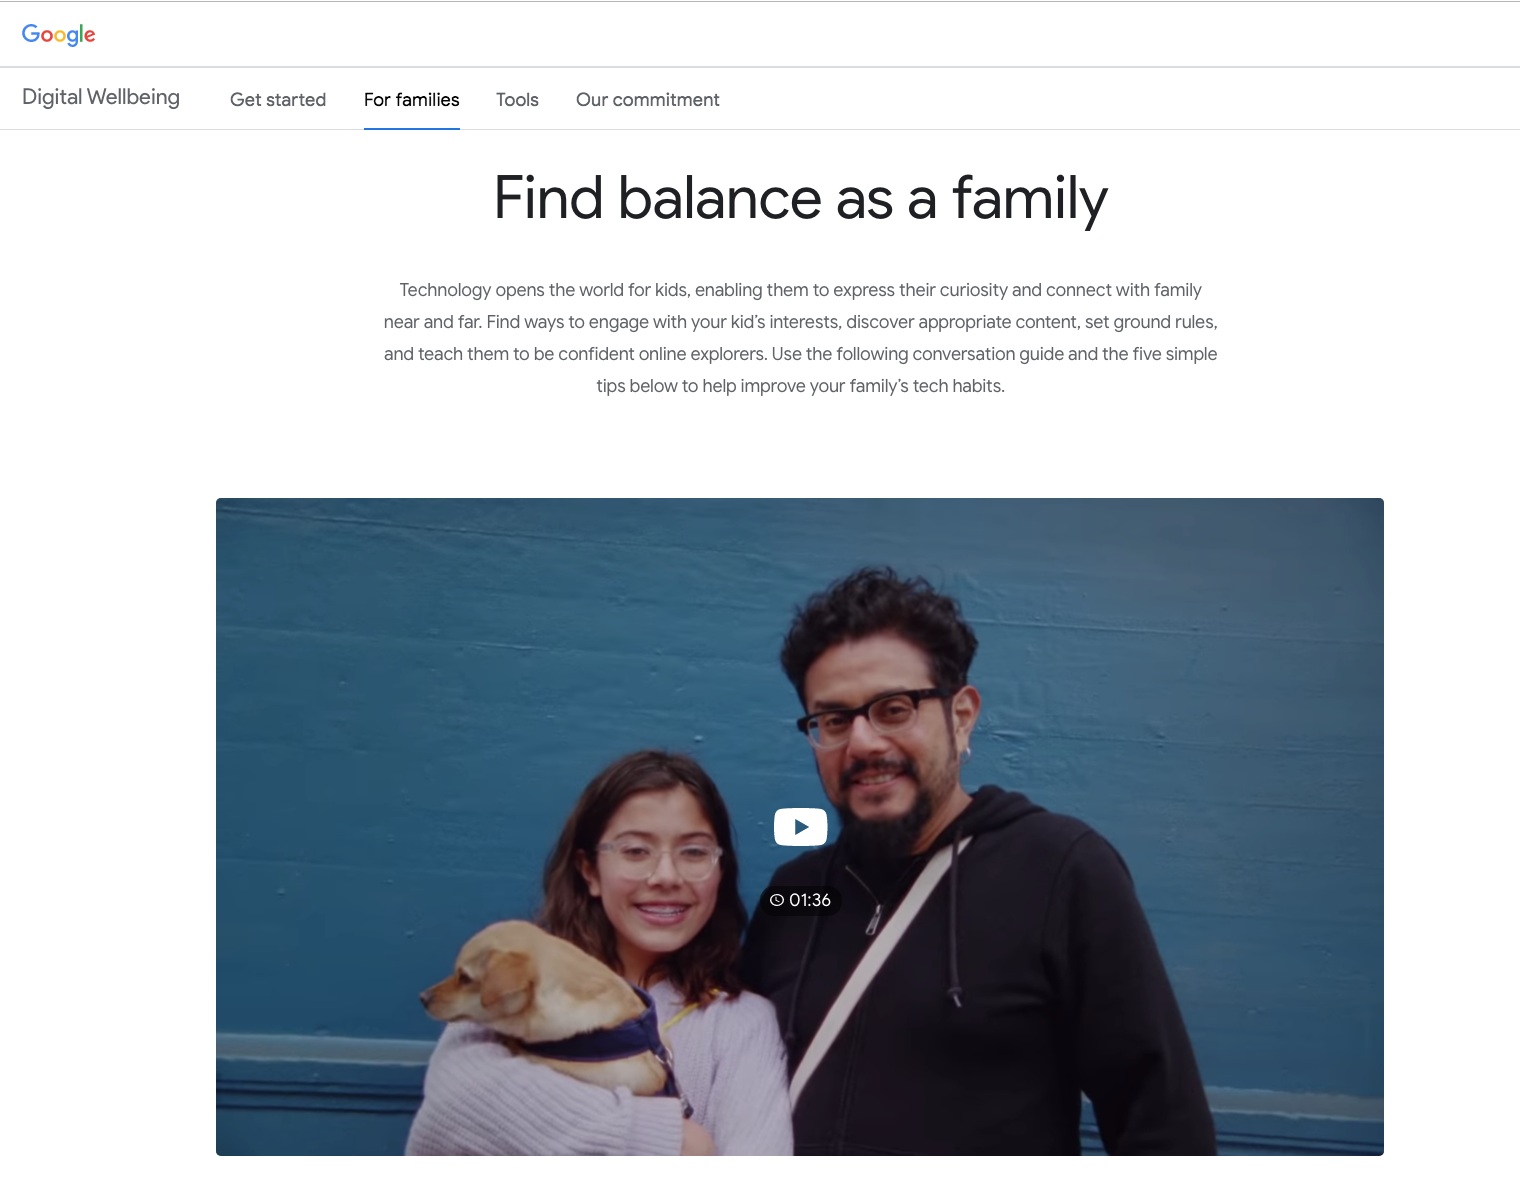
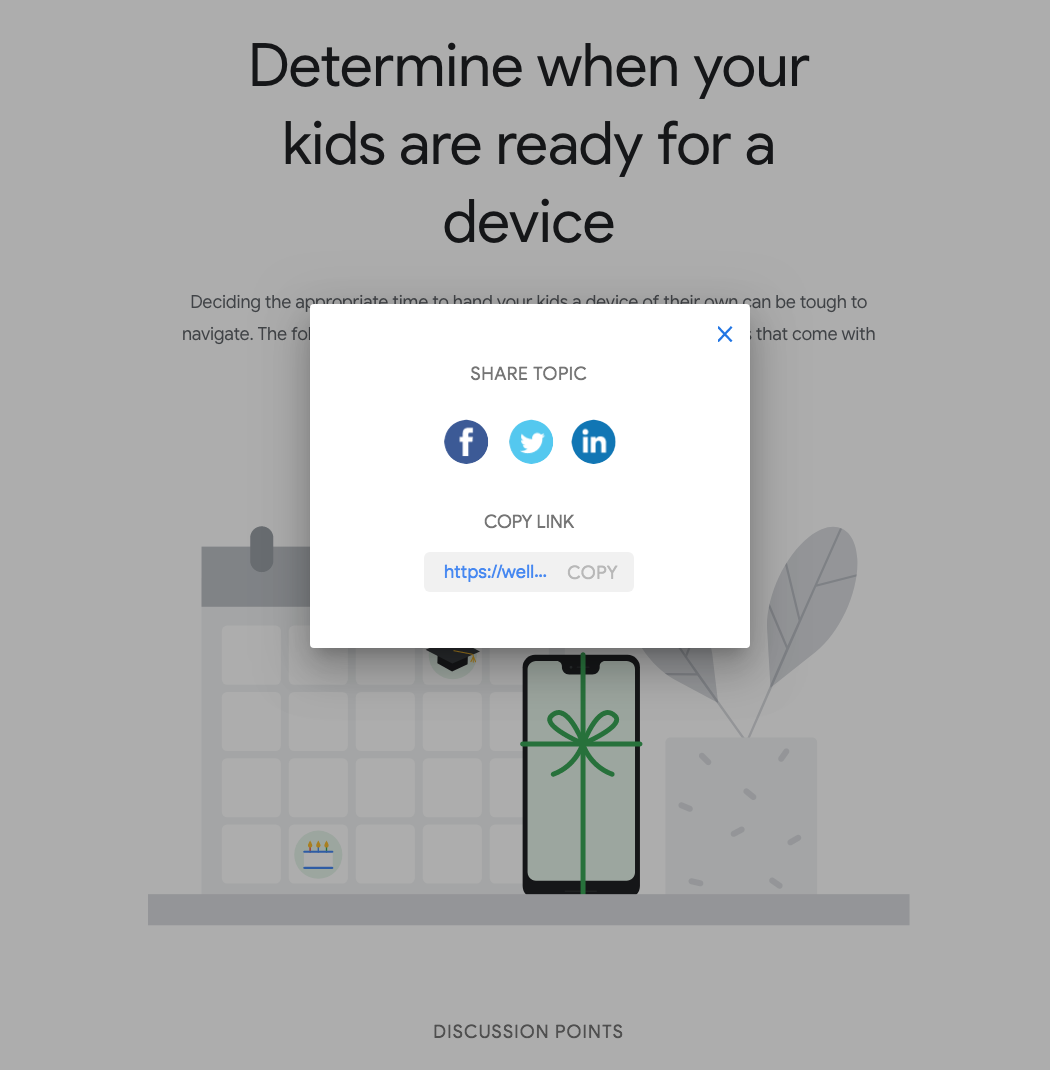
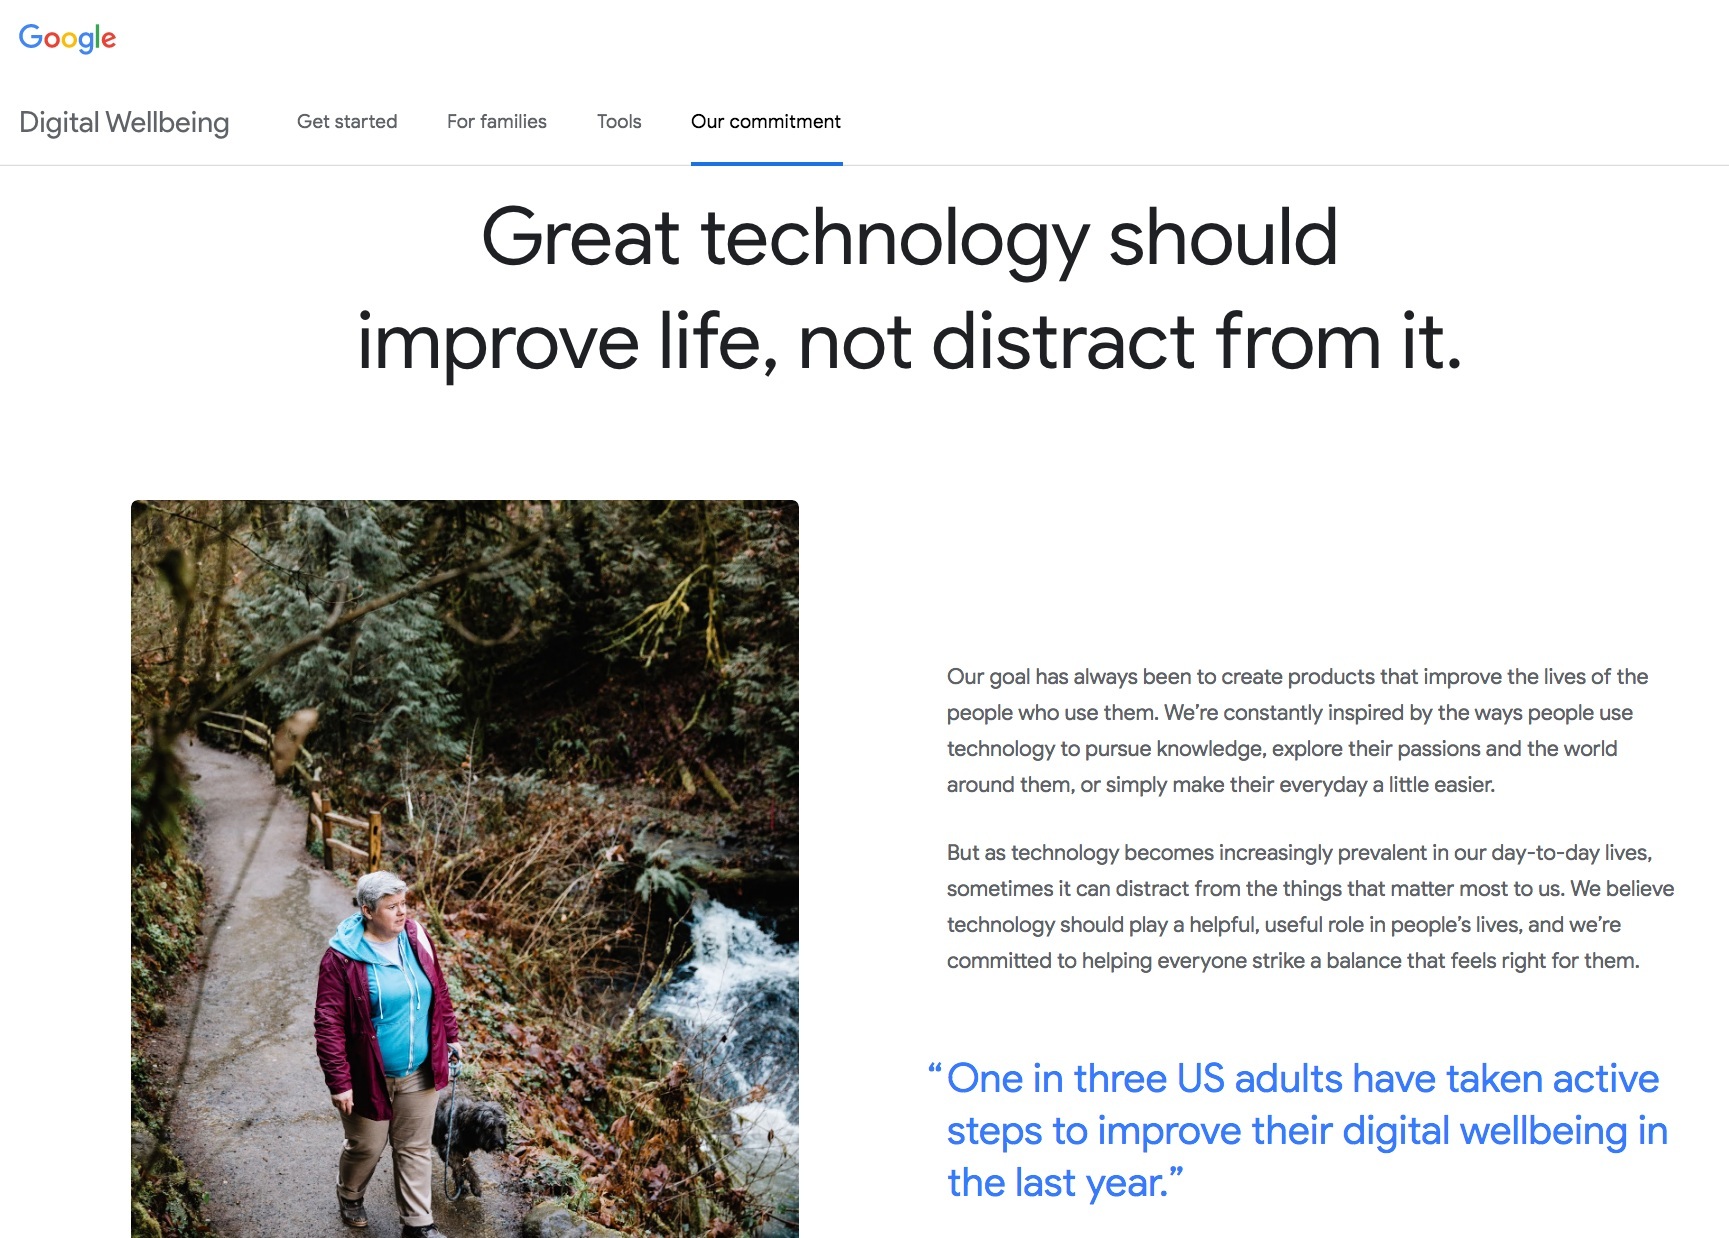
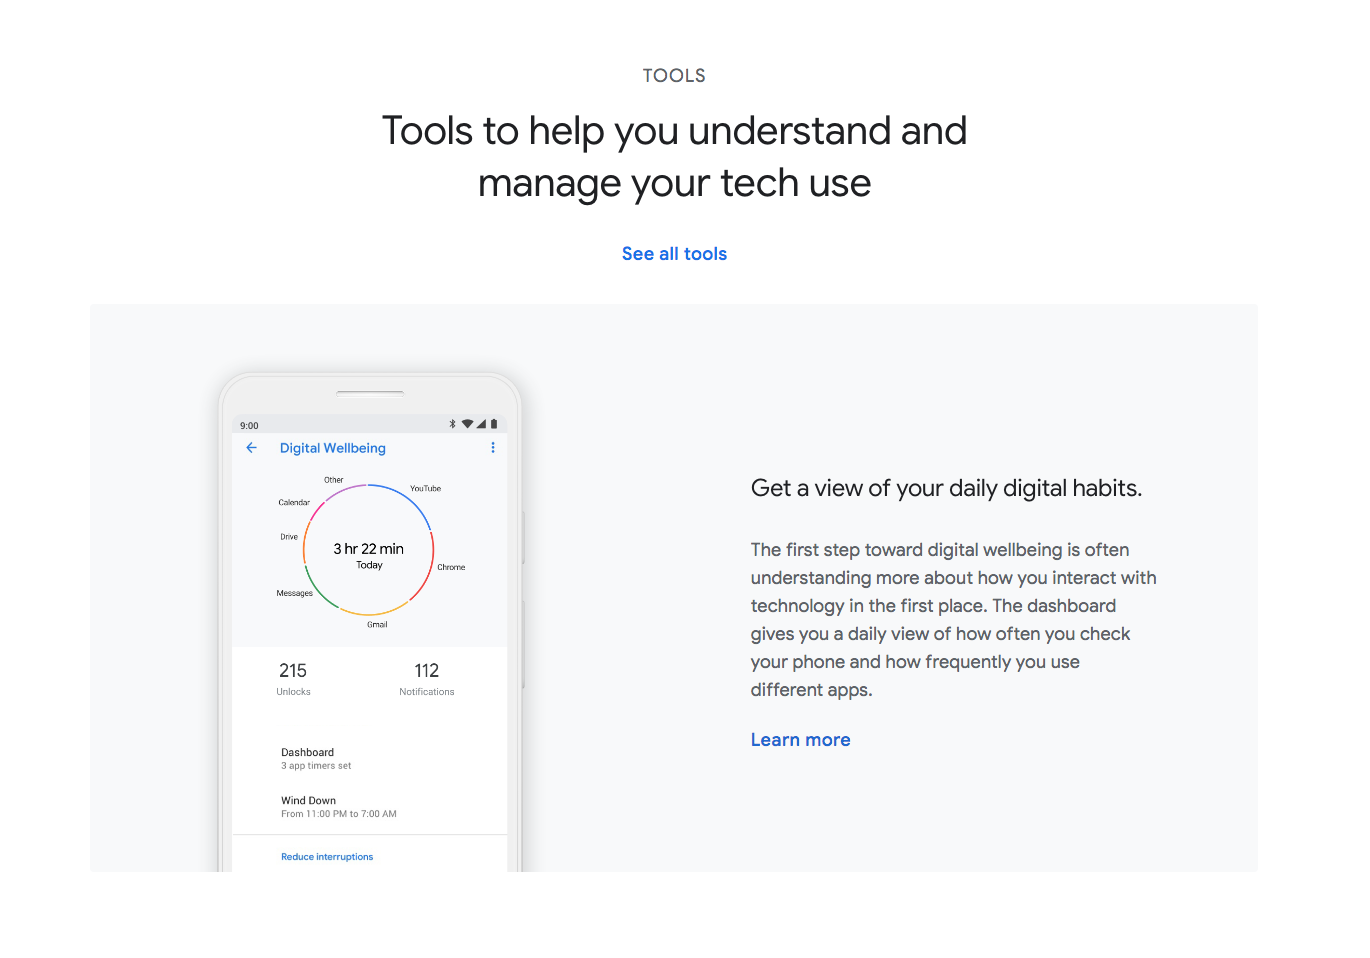
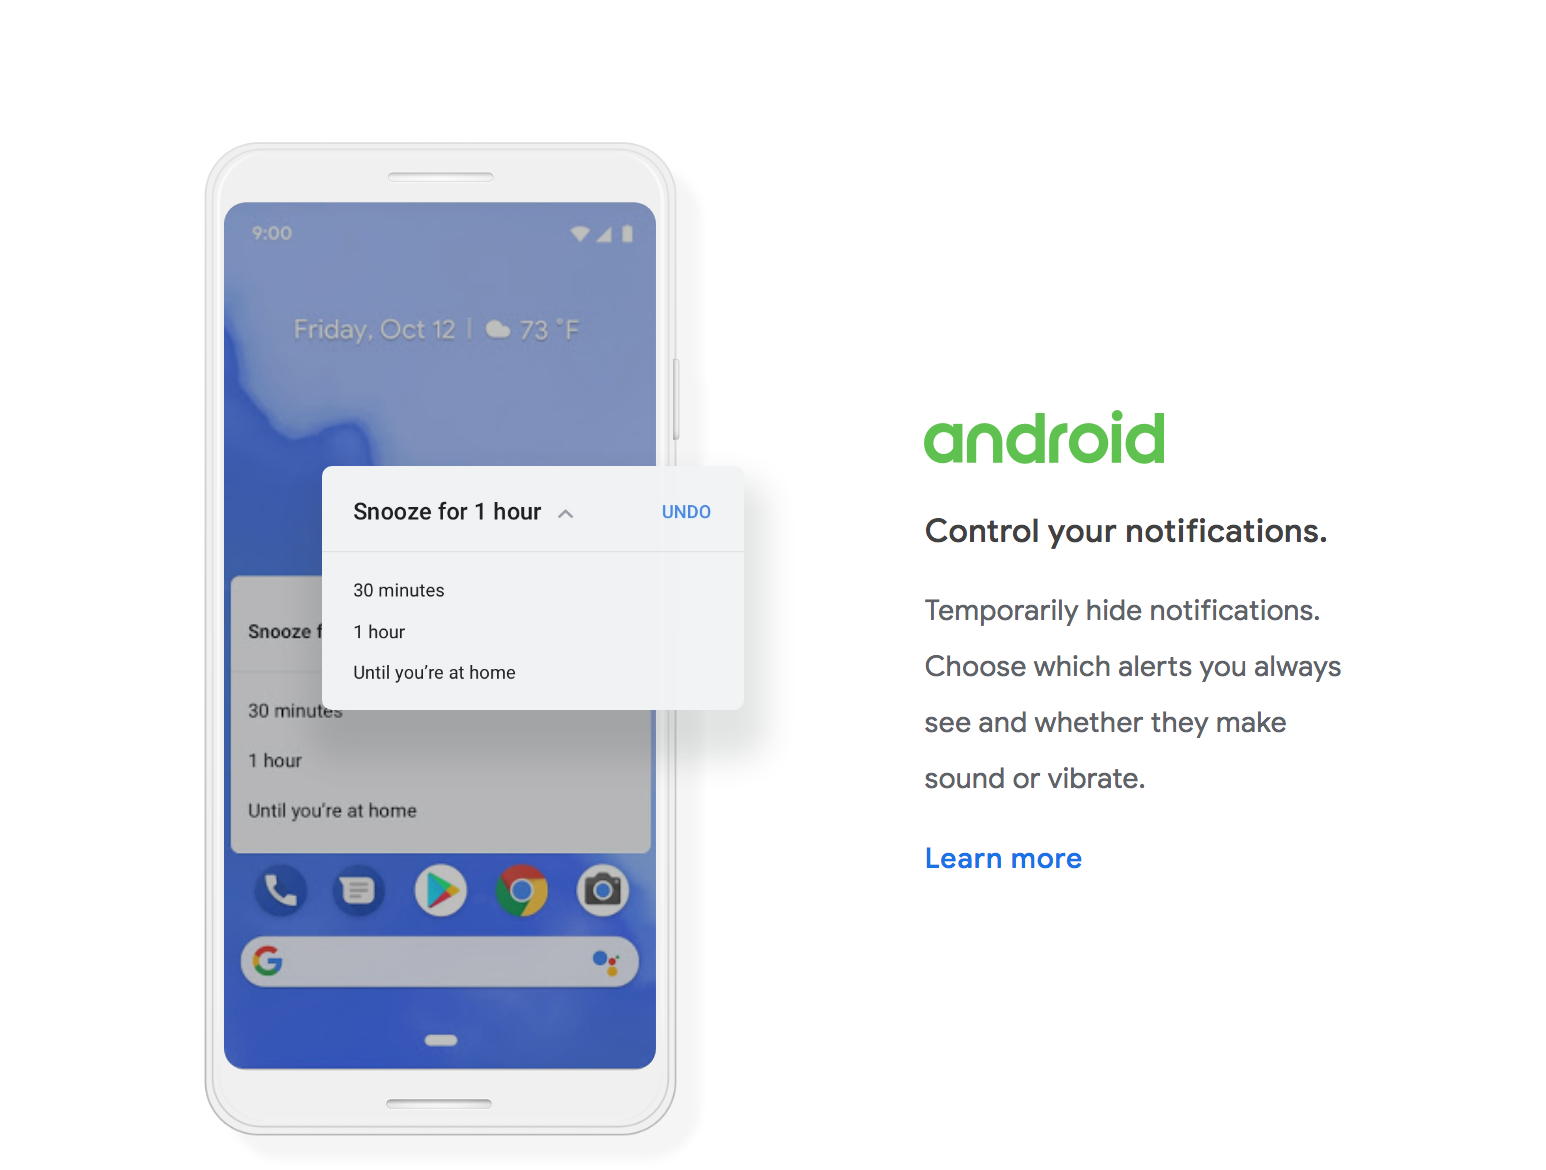
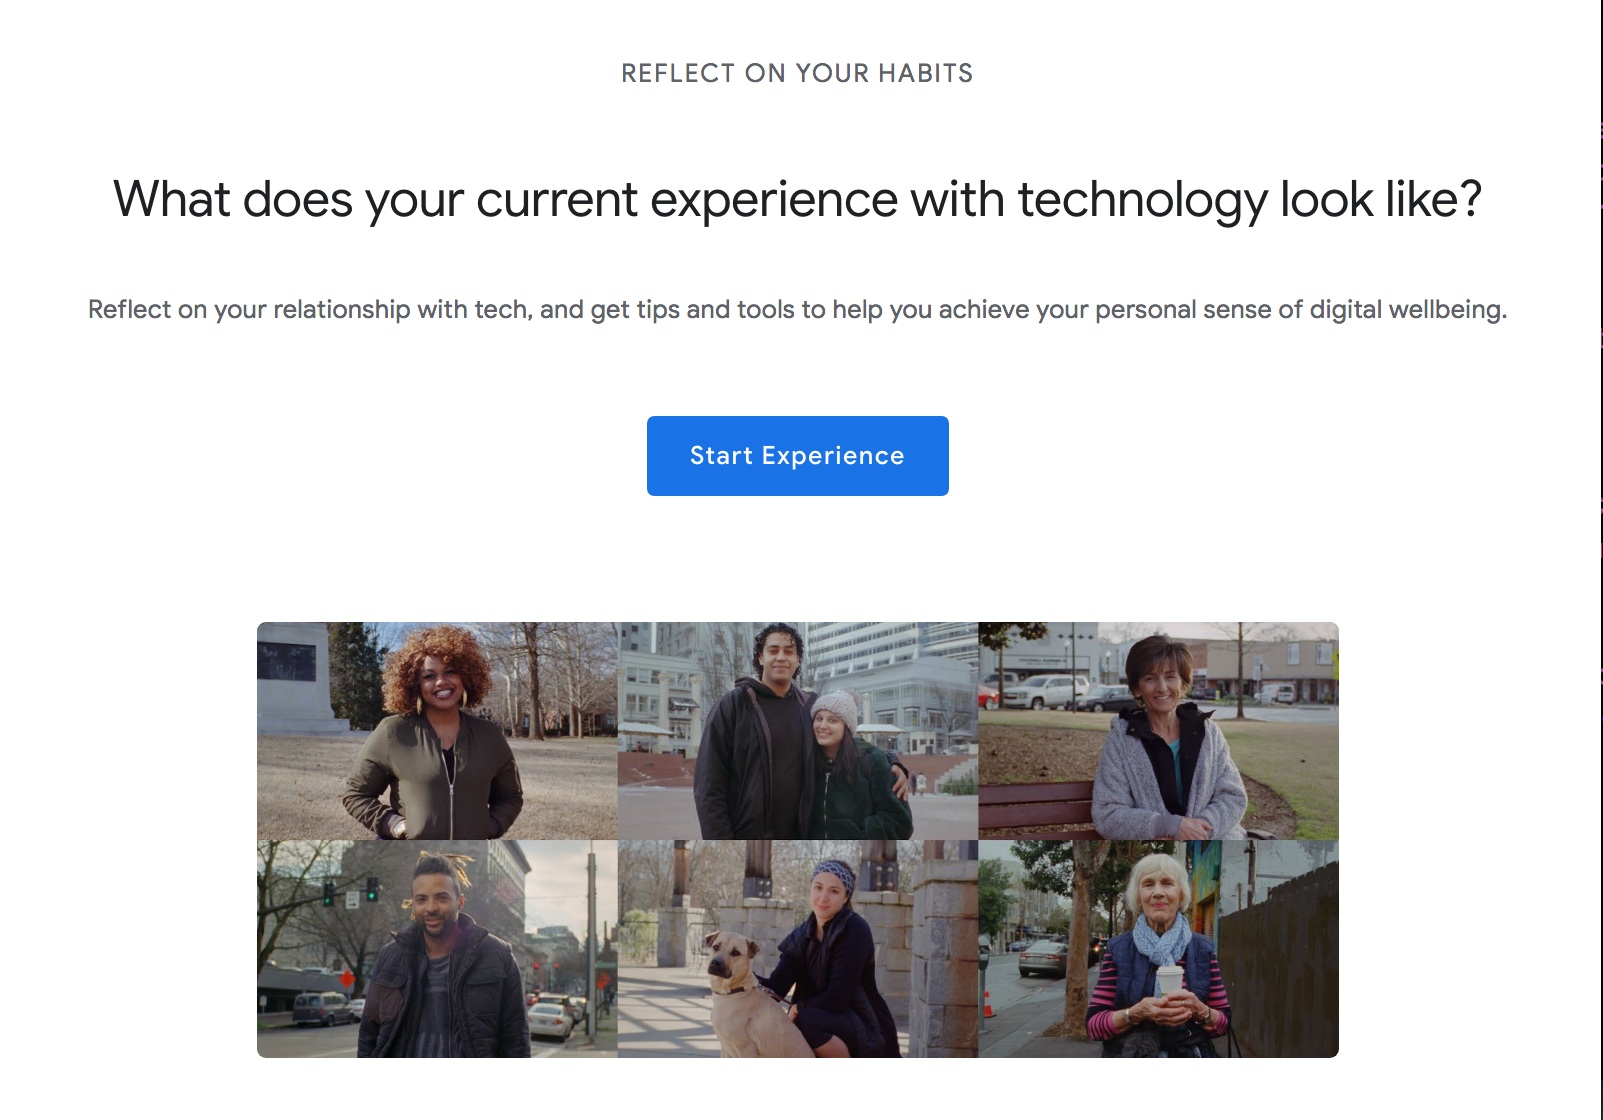
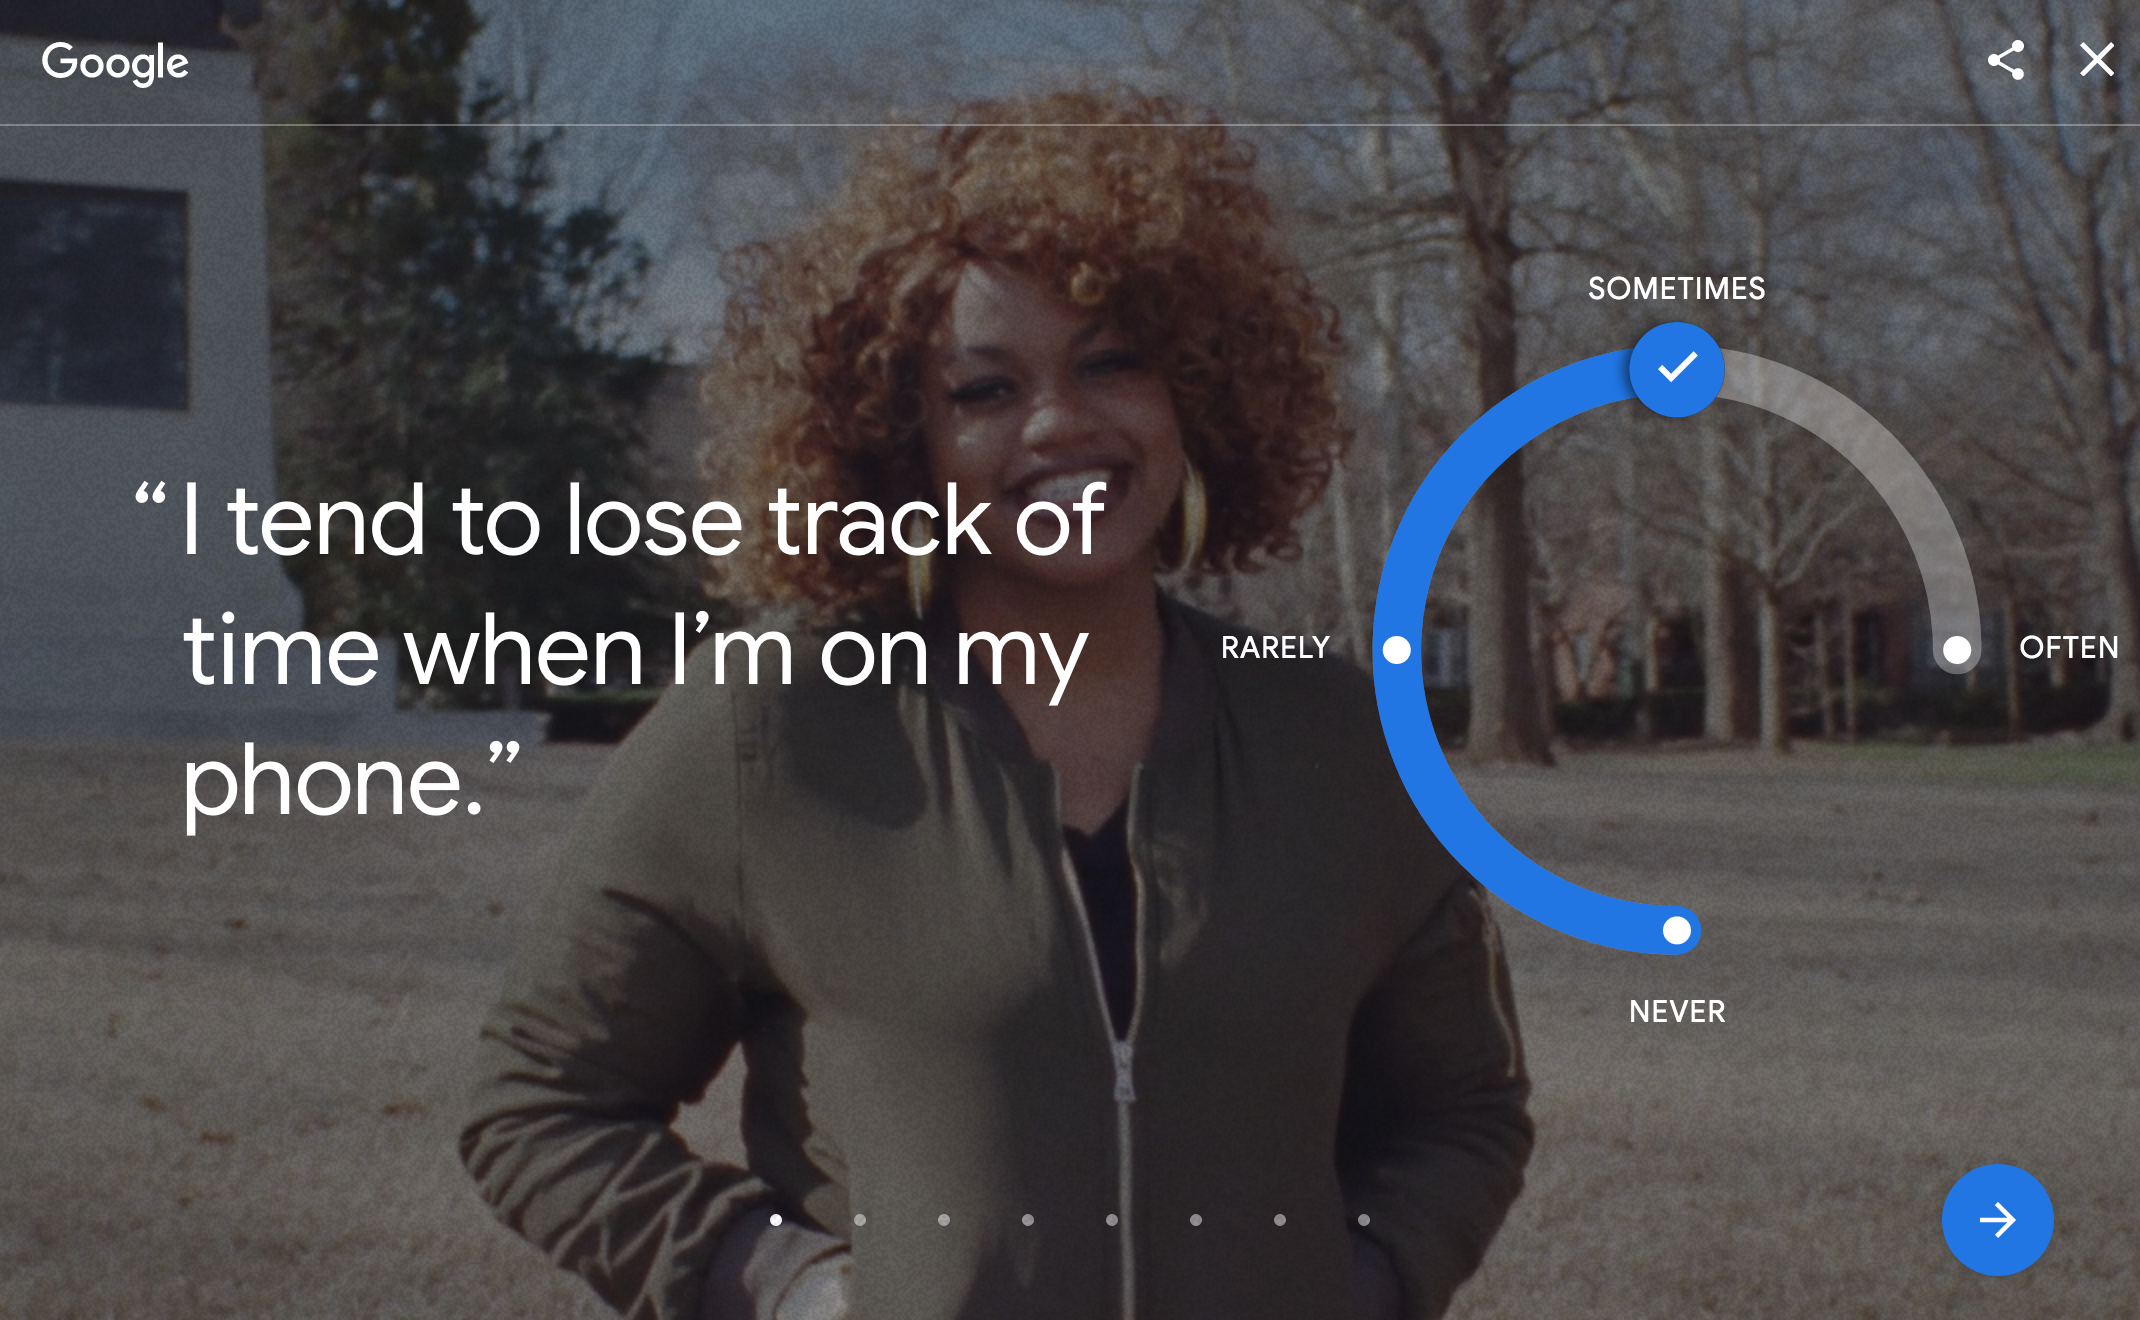
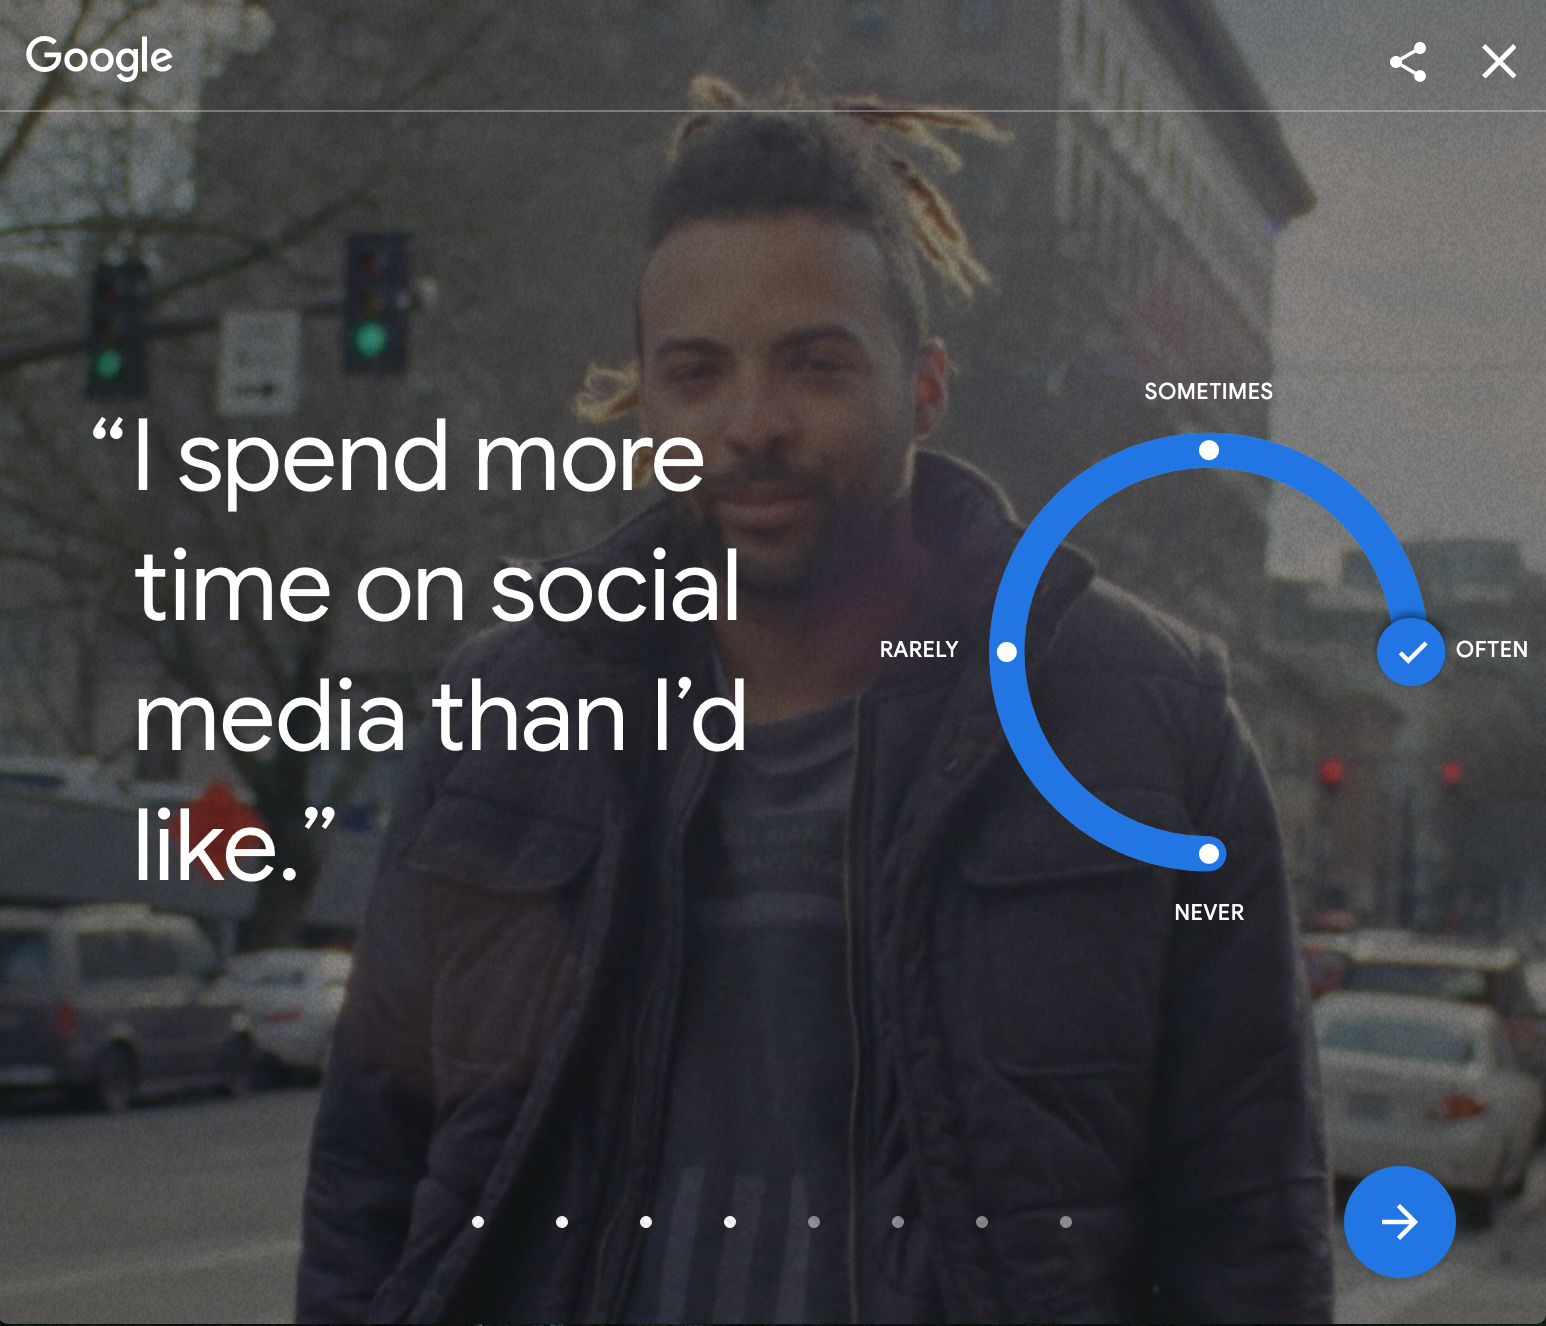
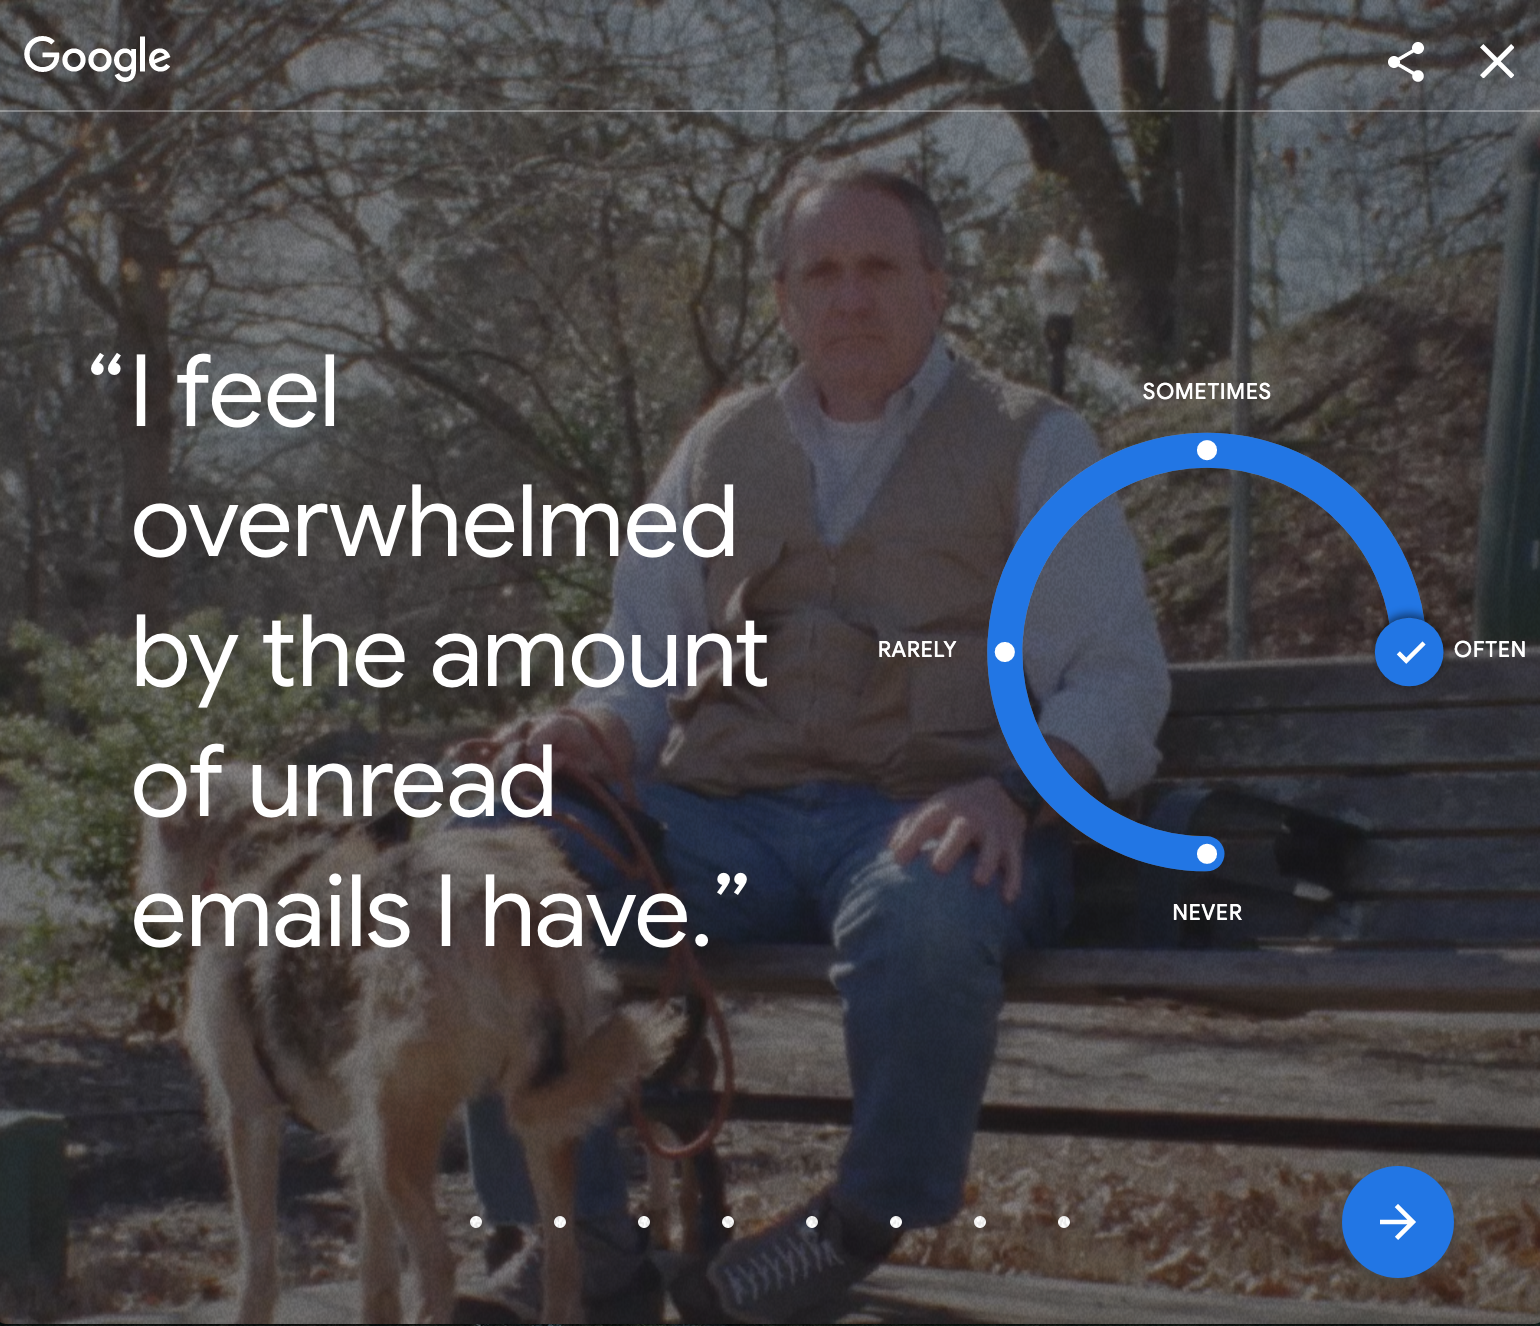
Description: I worked with Google product marketing managers and external agency partner, Instrument on the redesign and launch of the Digital Wellbeing website and an interactive self-evaluation tool. The website features stories, tips and tools to help people find their own balance with technology. The goal was to re-contextualize Google’s commitment to digital wellbeing through actionable goals, tips and inspirational videos. A section for families features a shareable/downloadable Family Discussion Guide to break down some of the biggest challenges families face with technology into 6 discussion topics and practical tips. For people who want to get right down to business, we integrated all the tips and tools into an interactive self-evaluation tool. Users can swipe through an eight-step questionnaire (desktop and mobile platforms supported) and evaluate their relationship with technology in a touch-activated dial. The resulting tips are curated based on the user’s responses.
Greeninfo network - web mapping and application development, 2017
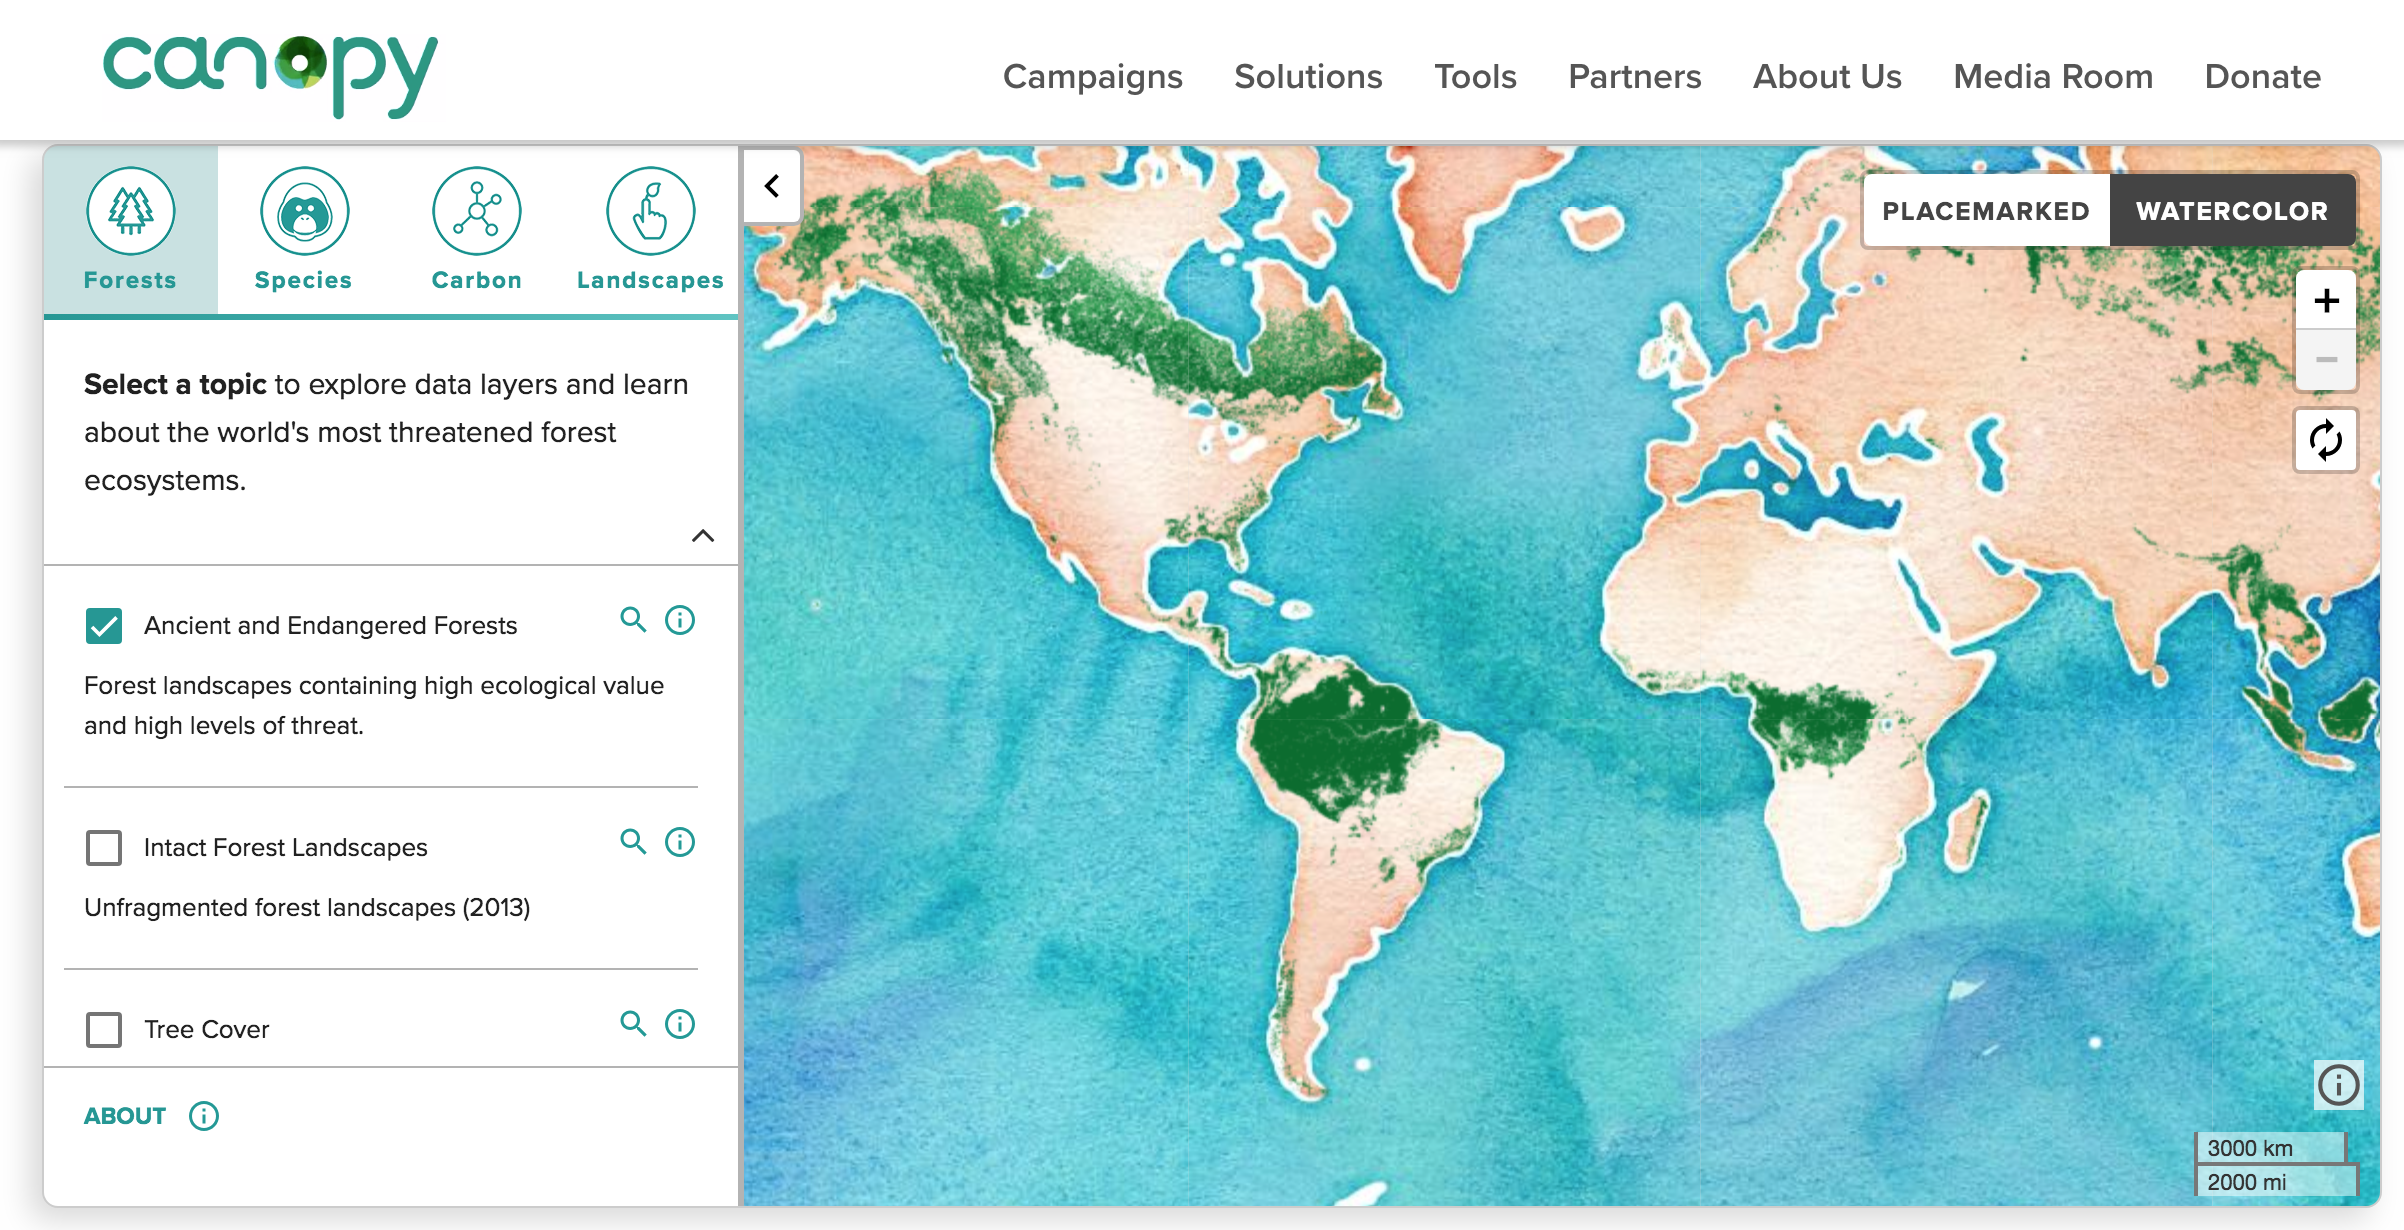

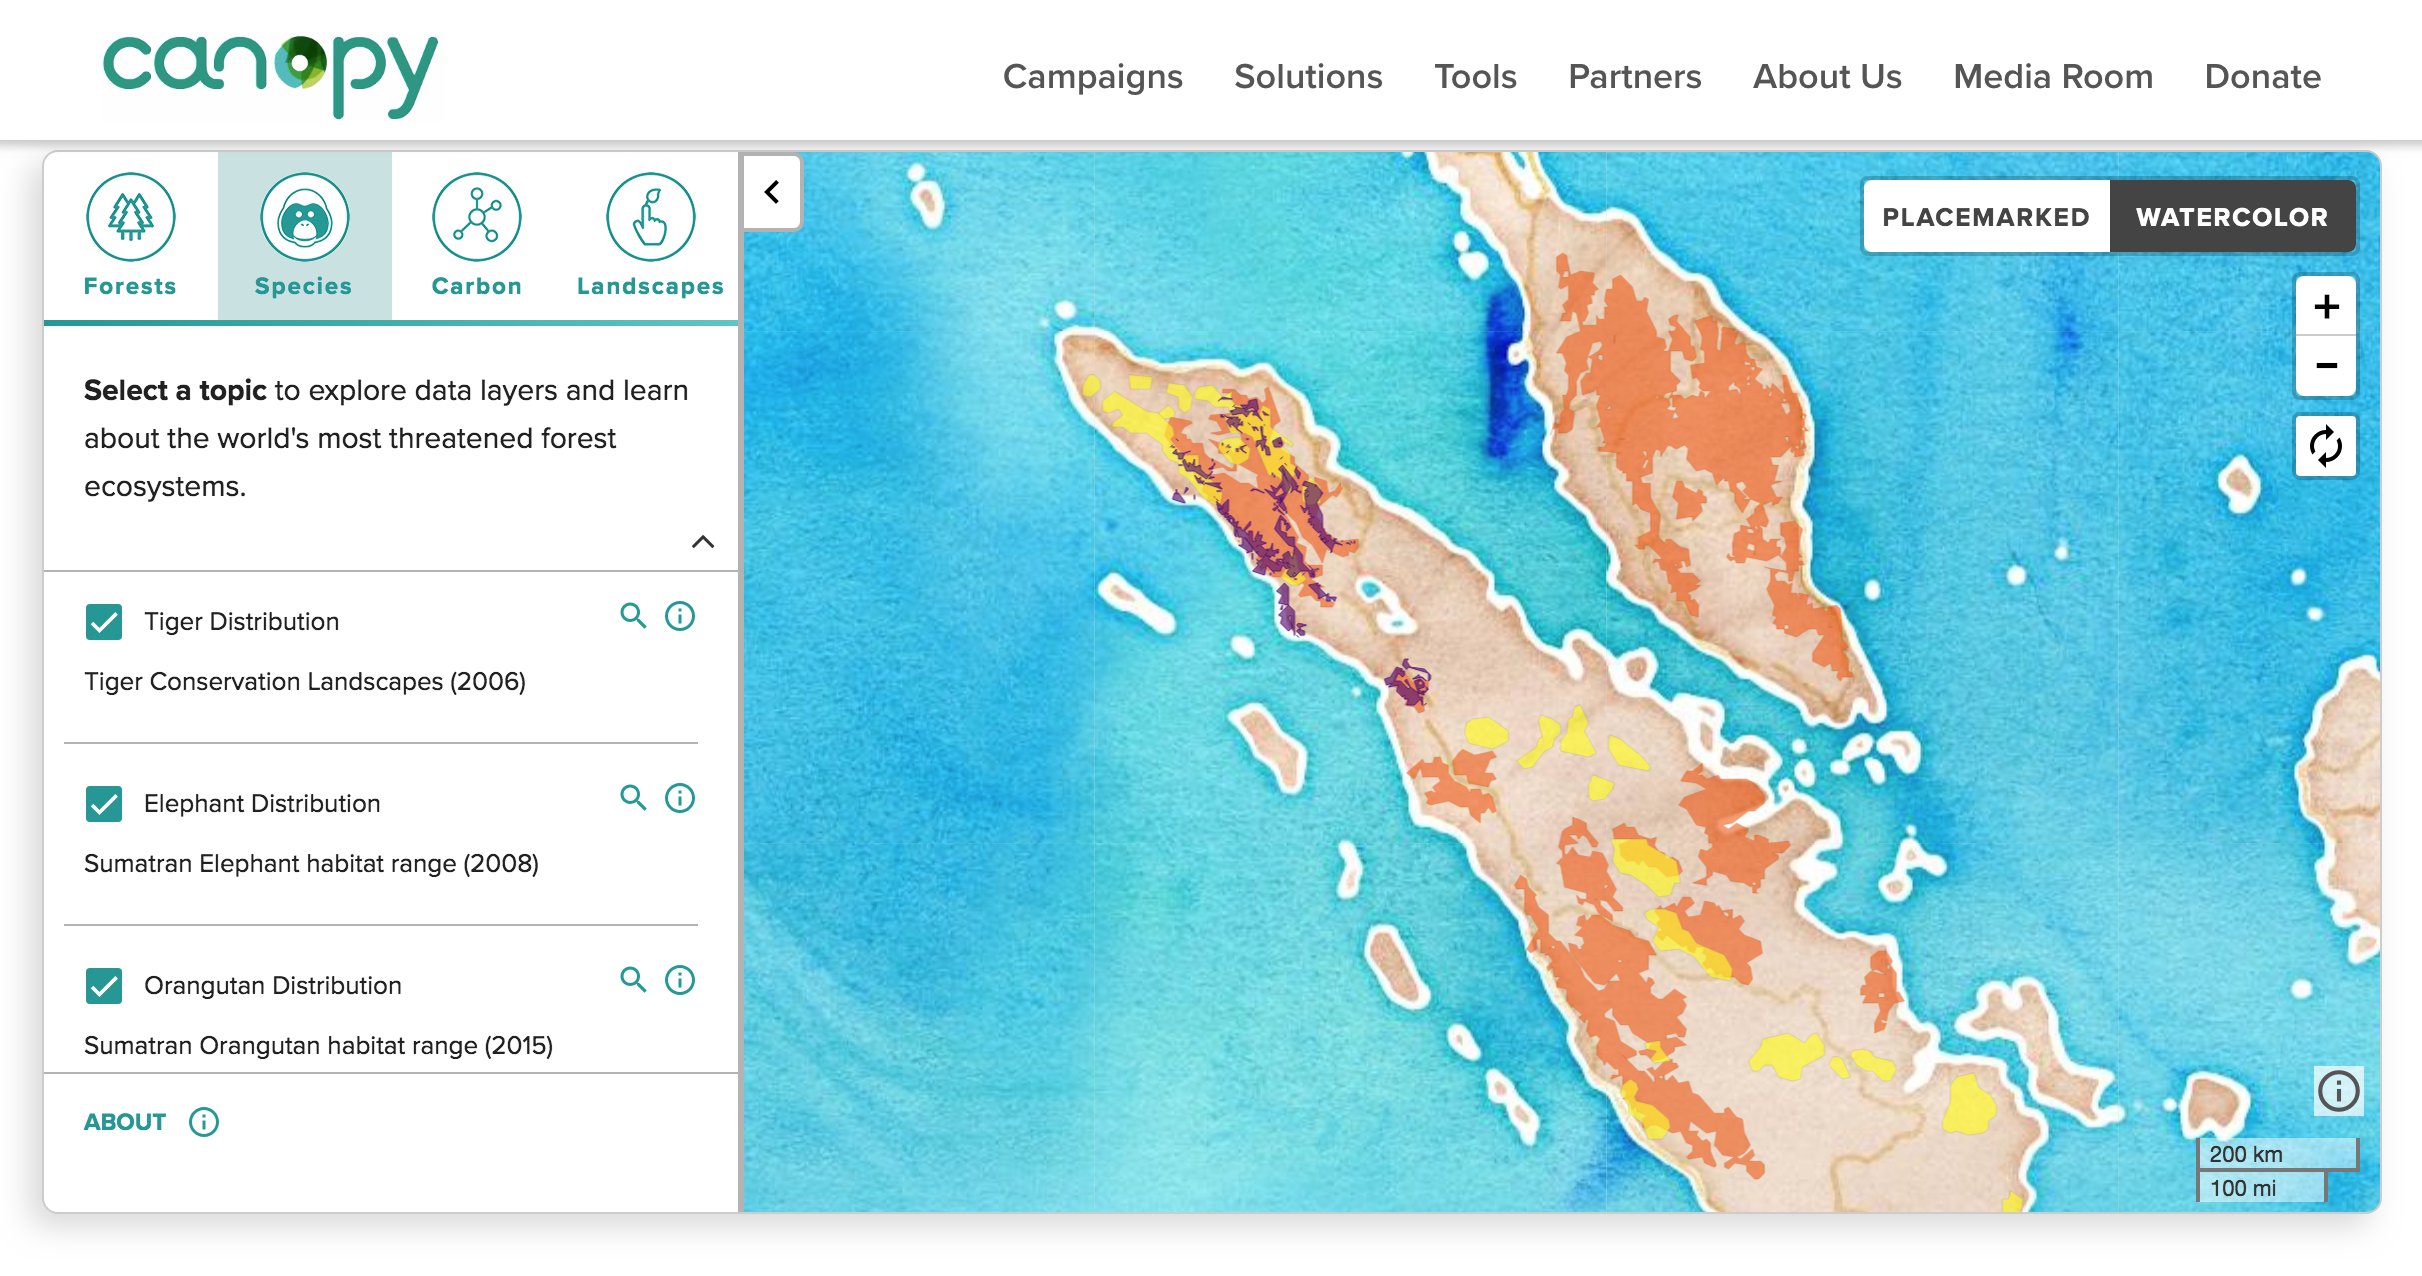
Type: ForestMapper. An interactive web application featuring ancient and endangered forests
Client: GreenInfo Network + Canopy
Date: April - December 2017
Description: GreenInfo Network visualizes and communicates information for organizations working in non profit and public interest sectors. The Canadian non profit, Canopy wanted an interactive mapping tool to help their stakeholders identify over 36 data layers involving ancient forests, climate change, and at-risk species critical to their work. ForestMapper is used to bring together fashion brands, suppliers, and conservation organizations to help create sustainable supply chains and identify areas of potential sourcing risk. On this project, I managed the research, data acquisition, design, and build of ForestMapper with a full stack developer and interaction designer. I was the lead contact between the client, Canopy and GreenInfo. I lead meetings, created timelines, identified risks and negotiated change orders and rates as needed. I developed and refined basic UX principles and wireframes in consultation with clients and the project team and made sure the overarching goal and progress was clearly communicated throughout the lifecycle of the project.
Greeninfo network - product marketing, 2017
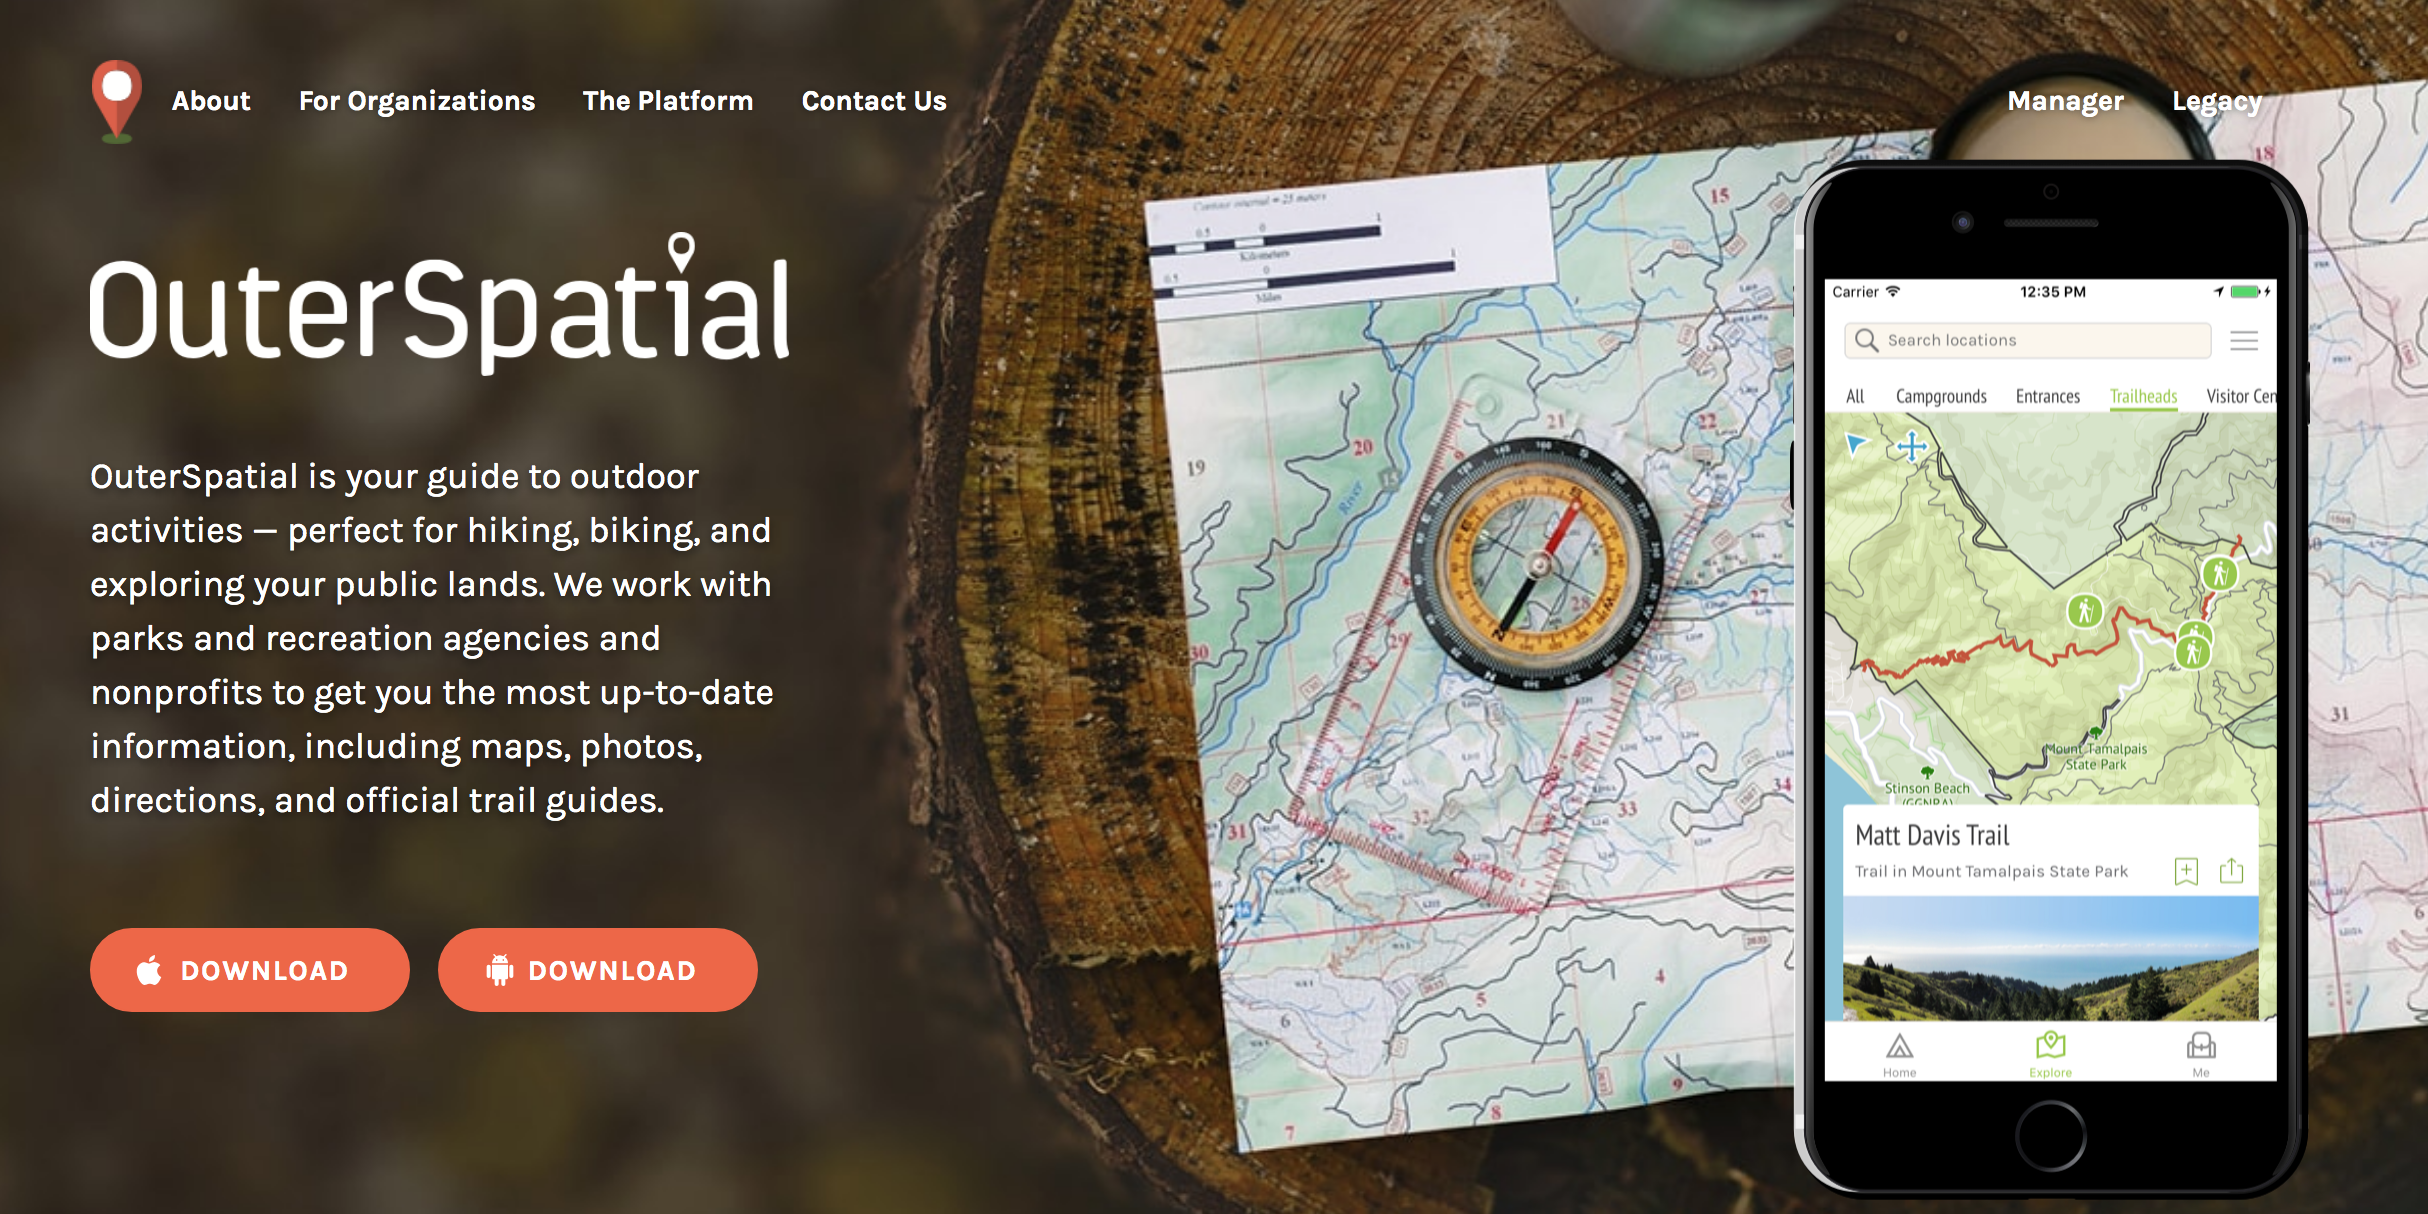
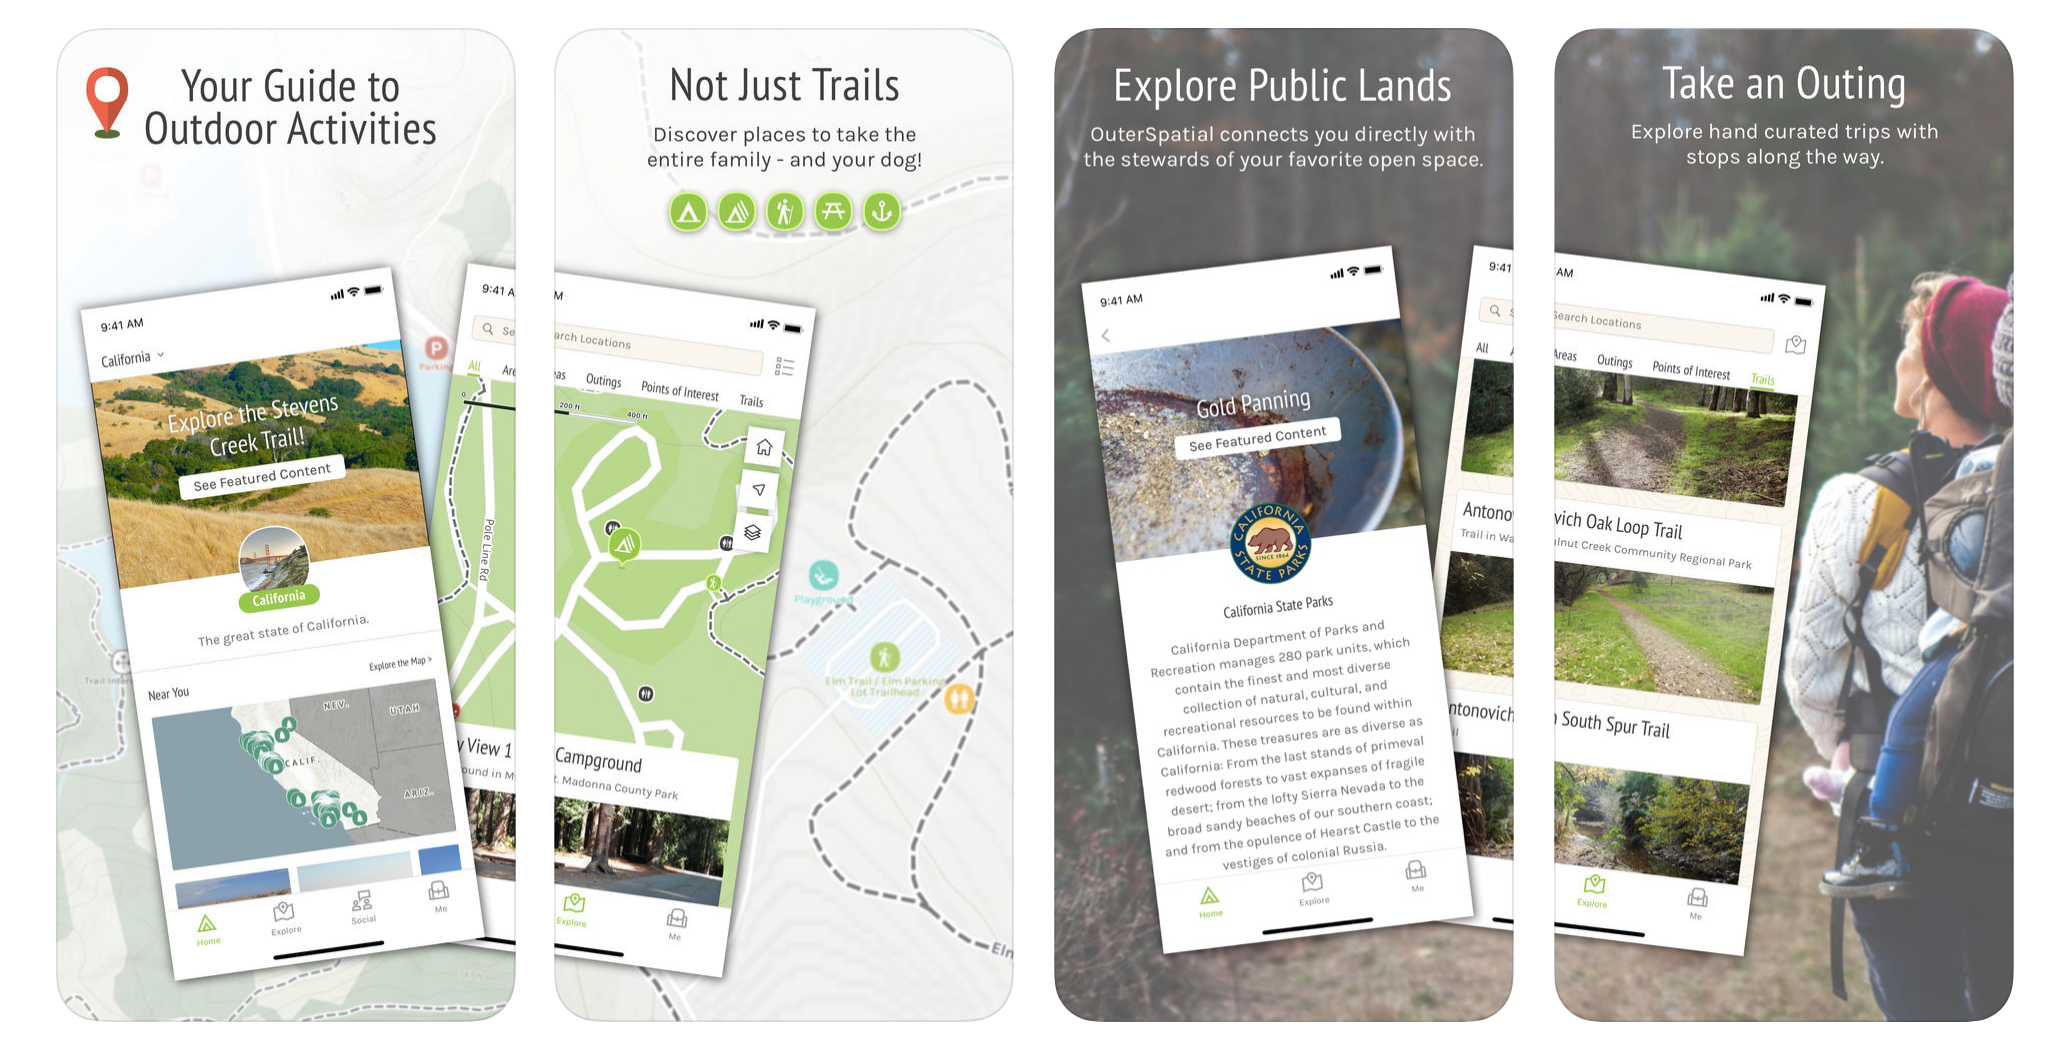
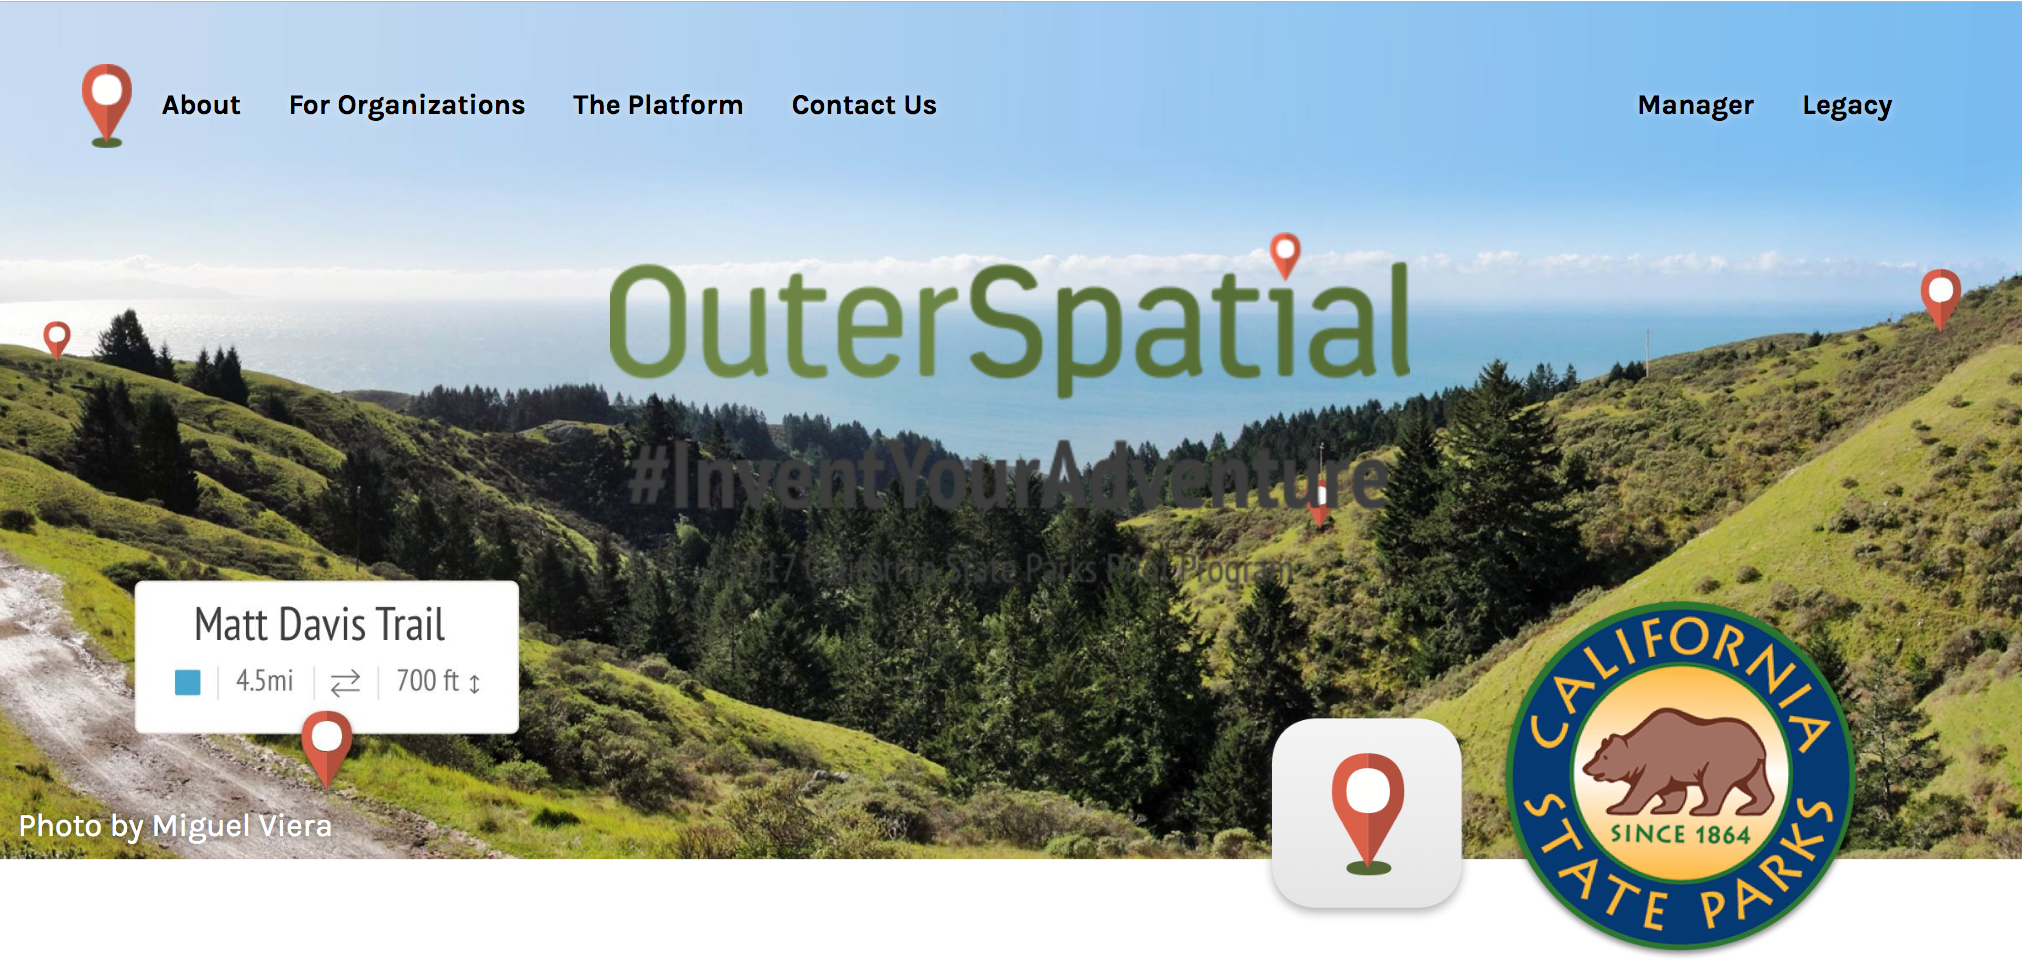
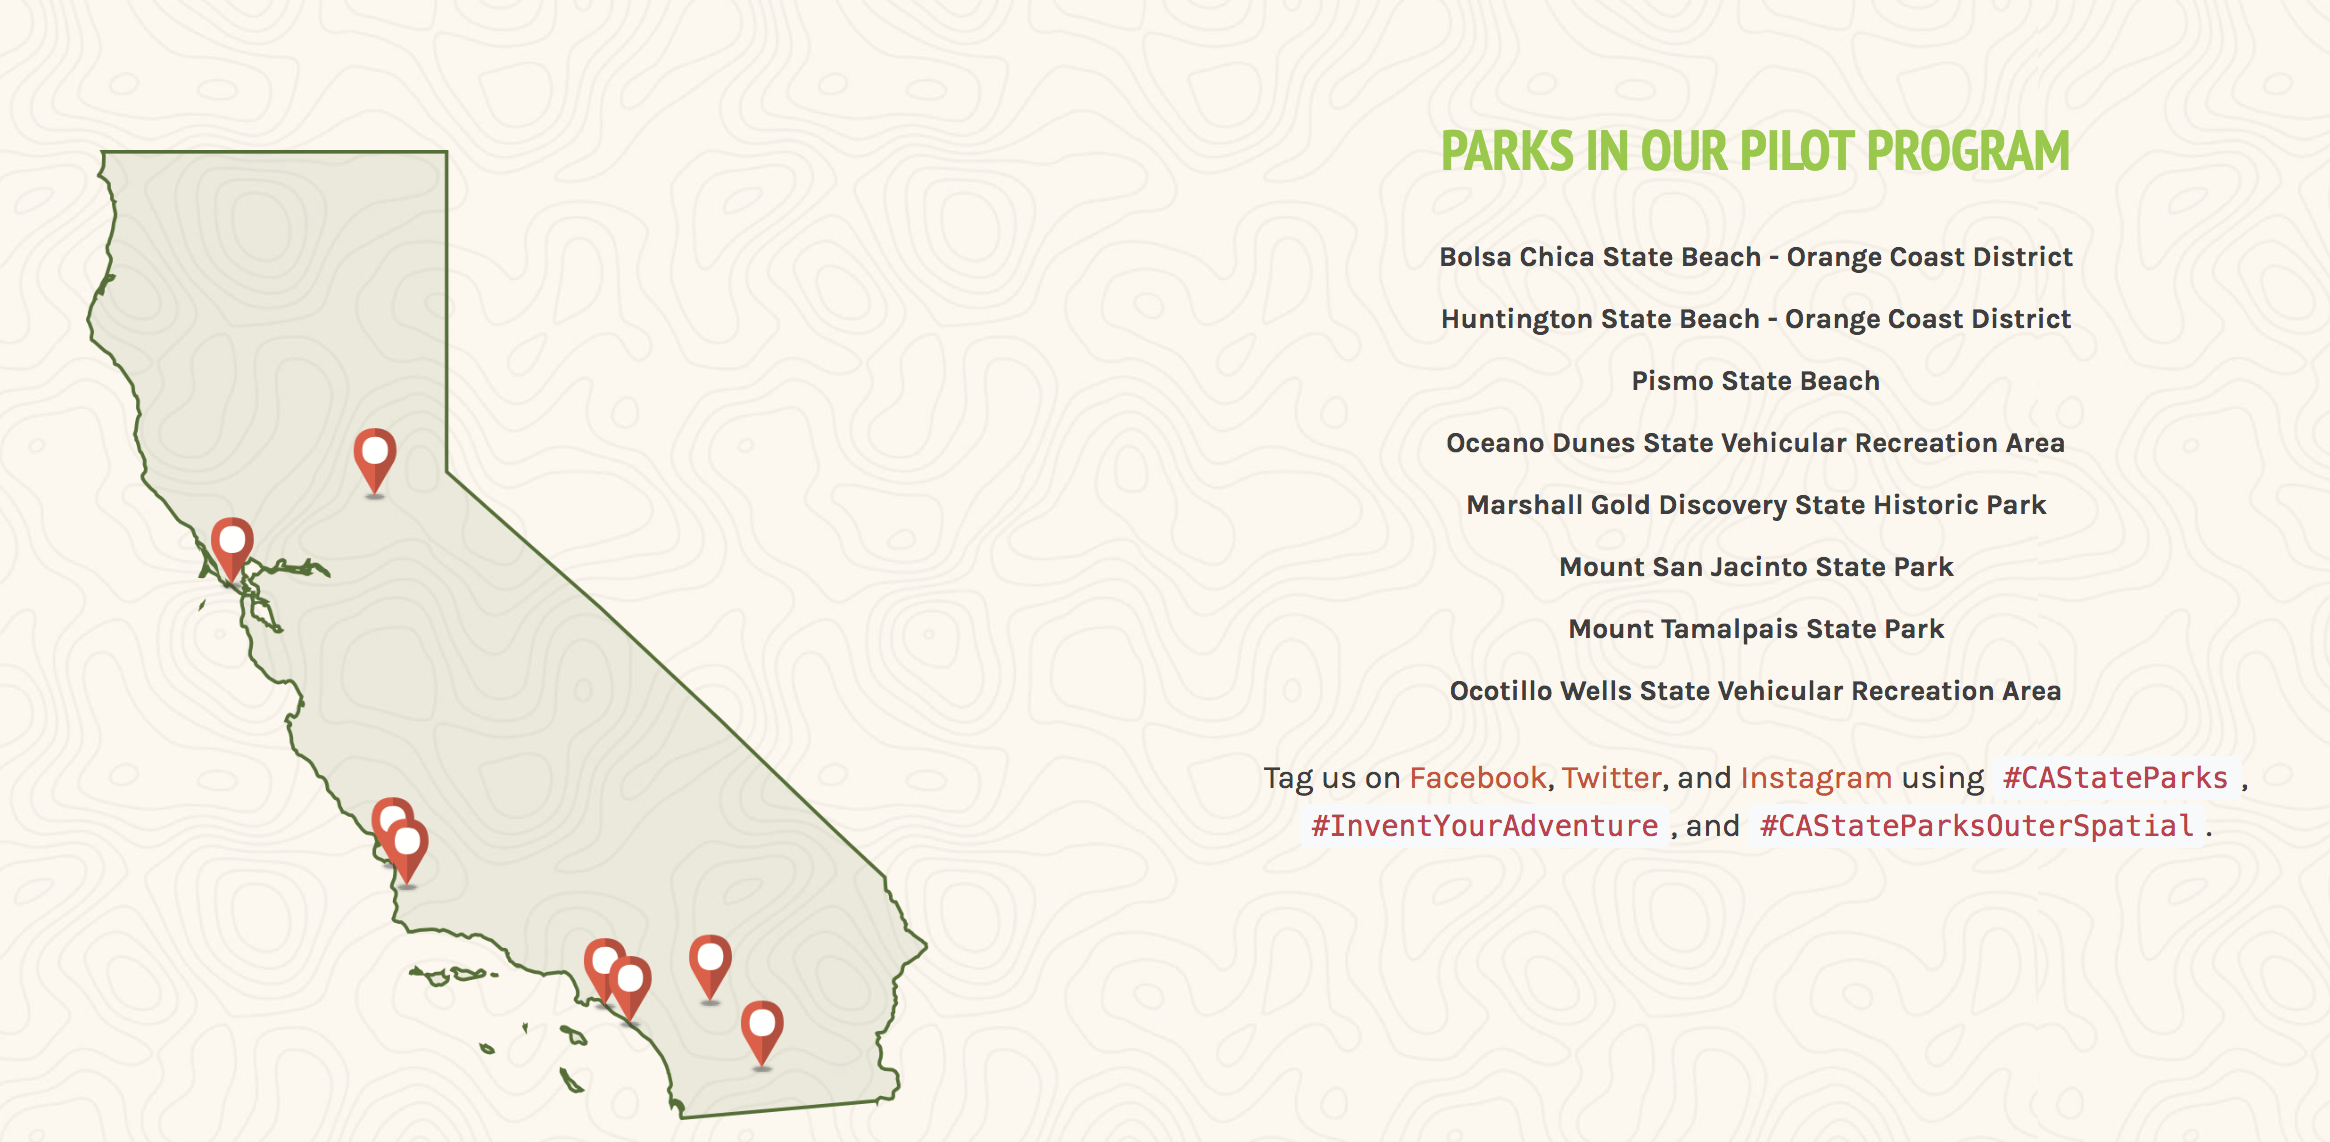
Type: OuterSpatial go to market pilot project and social media campaign
Client: GreenInfo Network, Trailhead Labs, California State Parks
Date: April - December 2017
Description: GreenInfo Network and California State Parks teamed up with startup, Trailhead Labs to test the use and adoption of OuterSpatial among State Park employees and public visitors in a 4 month pilot program. OuterSpatial is a native app (iOS devices only at the time) that enables organizations to manage and publish park and recreational data specific to the interests of their users. 8 State Parks were selected within the State Park system to be part of the 4 month pilot program (September - December). I worked with State Parks staff and administrators and Trailhead Labs engineers, to create user testing materials, develop the marketing strategy, timeline, and social media campaign. I designed the pilot program website and marketing assets. I used Google Analytics (for in-app use), Twitter analytics and bit.ly to track app adoption, promotions, and user engagement. I conducted interviews with State Park staff and generated weekly and monthly reports throughout the campaign.
Stamen - various projects - 2015 - 2016

© Stamen Design
Type: Selected data visualization products for an award-winning interaction design agency.
Client: Stamen
Date: Ongoing contract, June 2015 - October 2016
Description: Long-time collaborators and friends, I worked with design technologists and data scientists at Stamen to develop web mapping and other data visualization products. Produced an interactive, data driven app with a team of creative technologists and environmental scientists for an exhibit at the Tahoe Environmental Research Center. In June 2015, I was awarded a Stamen Fellowship and prototyped “Changing Shorelines” an interactive visualization displayed on the Visualizing the Bay exhibit at the Exploratorium museum. The exhibit features sea level rise from the deep geologic past to 100 years in the future. In addition to the fellowship, I worked with the agency to provide data quality assurance and data preparation services using open source mapping and analysis tools for custom software applications.
California academy of sciences - A Global Water Story, interactive google earth tour, 2012


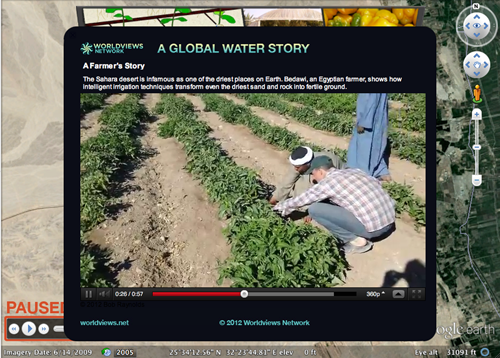


Type: Interactive Tour and Video, Google Earth
Collaborators: Google Earth, Denver Museum of Nature and Science, California Academy of Sciences, Worldviews Network, Visuamundo.
Date: May 2012
Description: Part of the Worldviews Network project, I managed a technical team of 5 and an external agency, Visuamundo to develop and ship an interactive video and downloadable tour in Google Earth. Scripts, storyboards and datasets from the full dome program were translated into Google Earth using Google Earth Tours. Users explore themes and innovative local strategies communities are doing to conserve freshwater resources. The tour and video were an online supplement to the Global Water Story, a full dome planetarium program screened at the Denver Museum of Nature and Science, May 2011.
Role & Duties: Producer. Managed workflow between lead developer at Visuamundo, Worldviews Network content experts, scientific advisors, editors and sound engineers. Storyboarding, script writing, data management and visualization.
Financial support: NOAA's Office of Education and Google Earth Outreach/Tides Foundation.
california academy of sciences - Clue Into Climate, interactive educational content, 2010


Type: Digital media-based curriculum for KQED
Collaborators: KQED Education Network, Center for Biodiversity Research & Information, California Academy of Sciences.
Date: July 2010
Description: A four-part series of lesson plans and multimedia products exploring the causes of climate change, its impacts on freshwater and ecosystems, and strategies for curbing and adapting to climate change.
Role: Data visualization (mapping) and curriculum development for Lesson 2b: Adapting to Climate Change, connecting principles of Climate Literacy, STEM, and Next Generation Science Standards for grades 4 - 8. Translated content and developed media assets from this project into ibooks textbook series and courses on iTunes U. Download the 2010 lesson 2b: Adapting to Climate Change